Article
Nov 13, 2025
AI Data Analysis 2025: Automated Insights Guide
Automate data analysis with AI. Transform raw data to actionable insights. Tools, techniques, examples.

Table of Contents
Introduction
AI Data Analysis: 2025 Market & Impact
7 AI Data Analysis Use Cases
How AI Data Analysis Works
Top Platforms Compared
Implementation Roadmap
KPIs, ROI, and Success Stories
Checklist for Adoption
Conclusion
Introduction
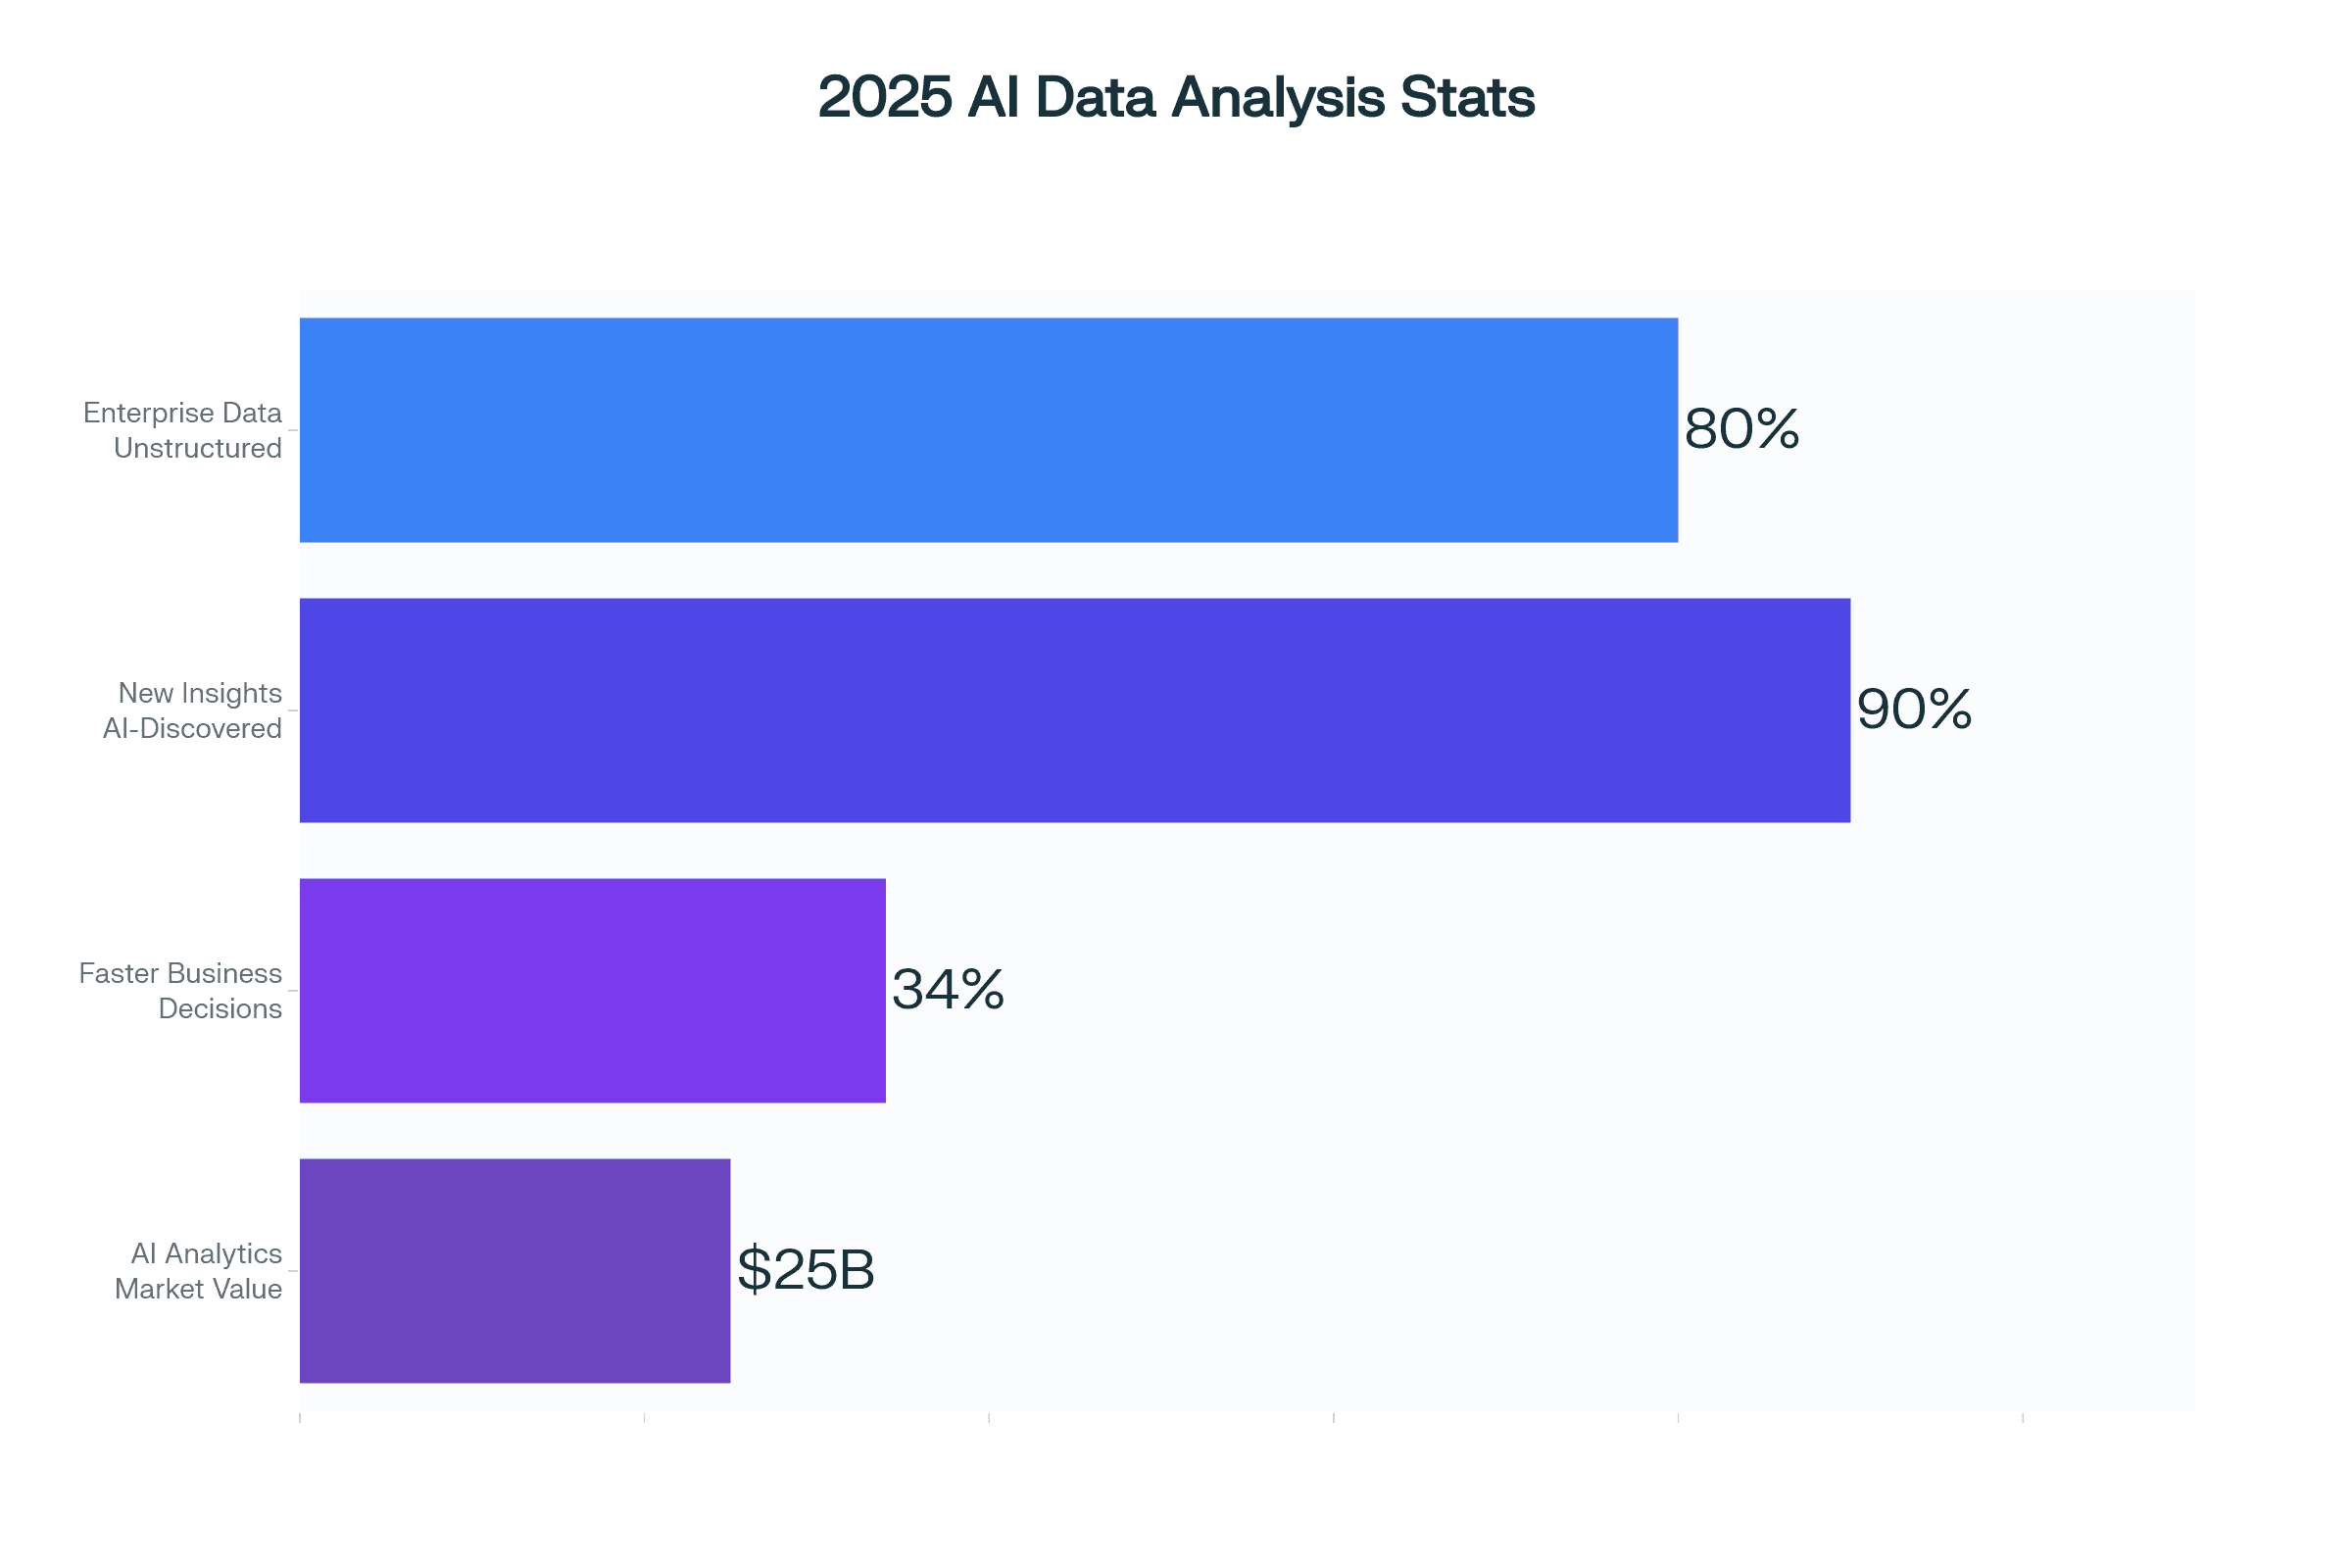
The business world runs on data… and drowns in it. In 2025, 80% of enterprise data is unstructured, and traditional BI tools miss 90% of its actionable insight.
AI-driven data analysis changes that—surfacing deep patterns, automating discovery, and moving you from dashboards to decisions faster than ever before.
With the global AI analytics market expected to exceed $25B this year, companies that embrace automation in data analysis outperform their peers in both speed and accuracy of execution.
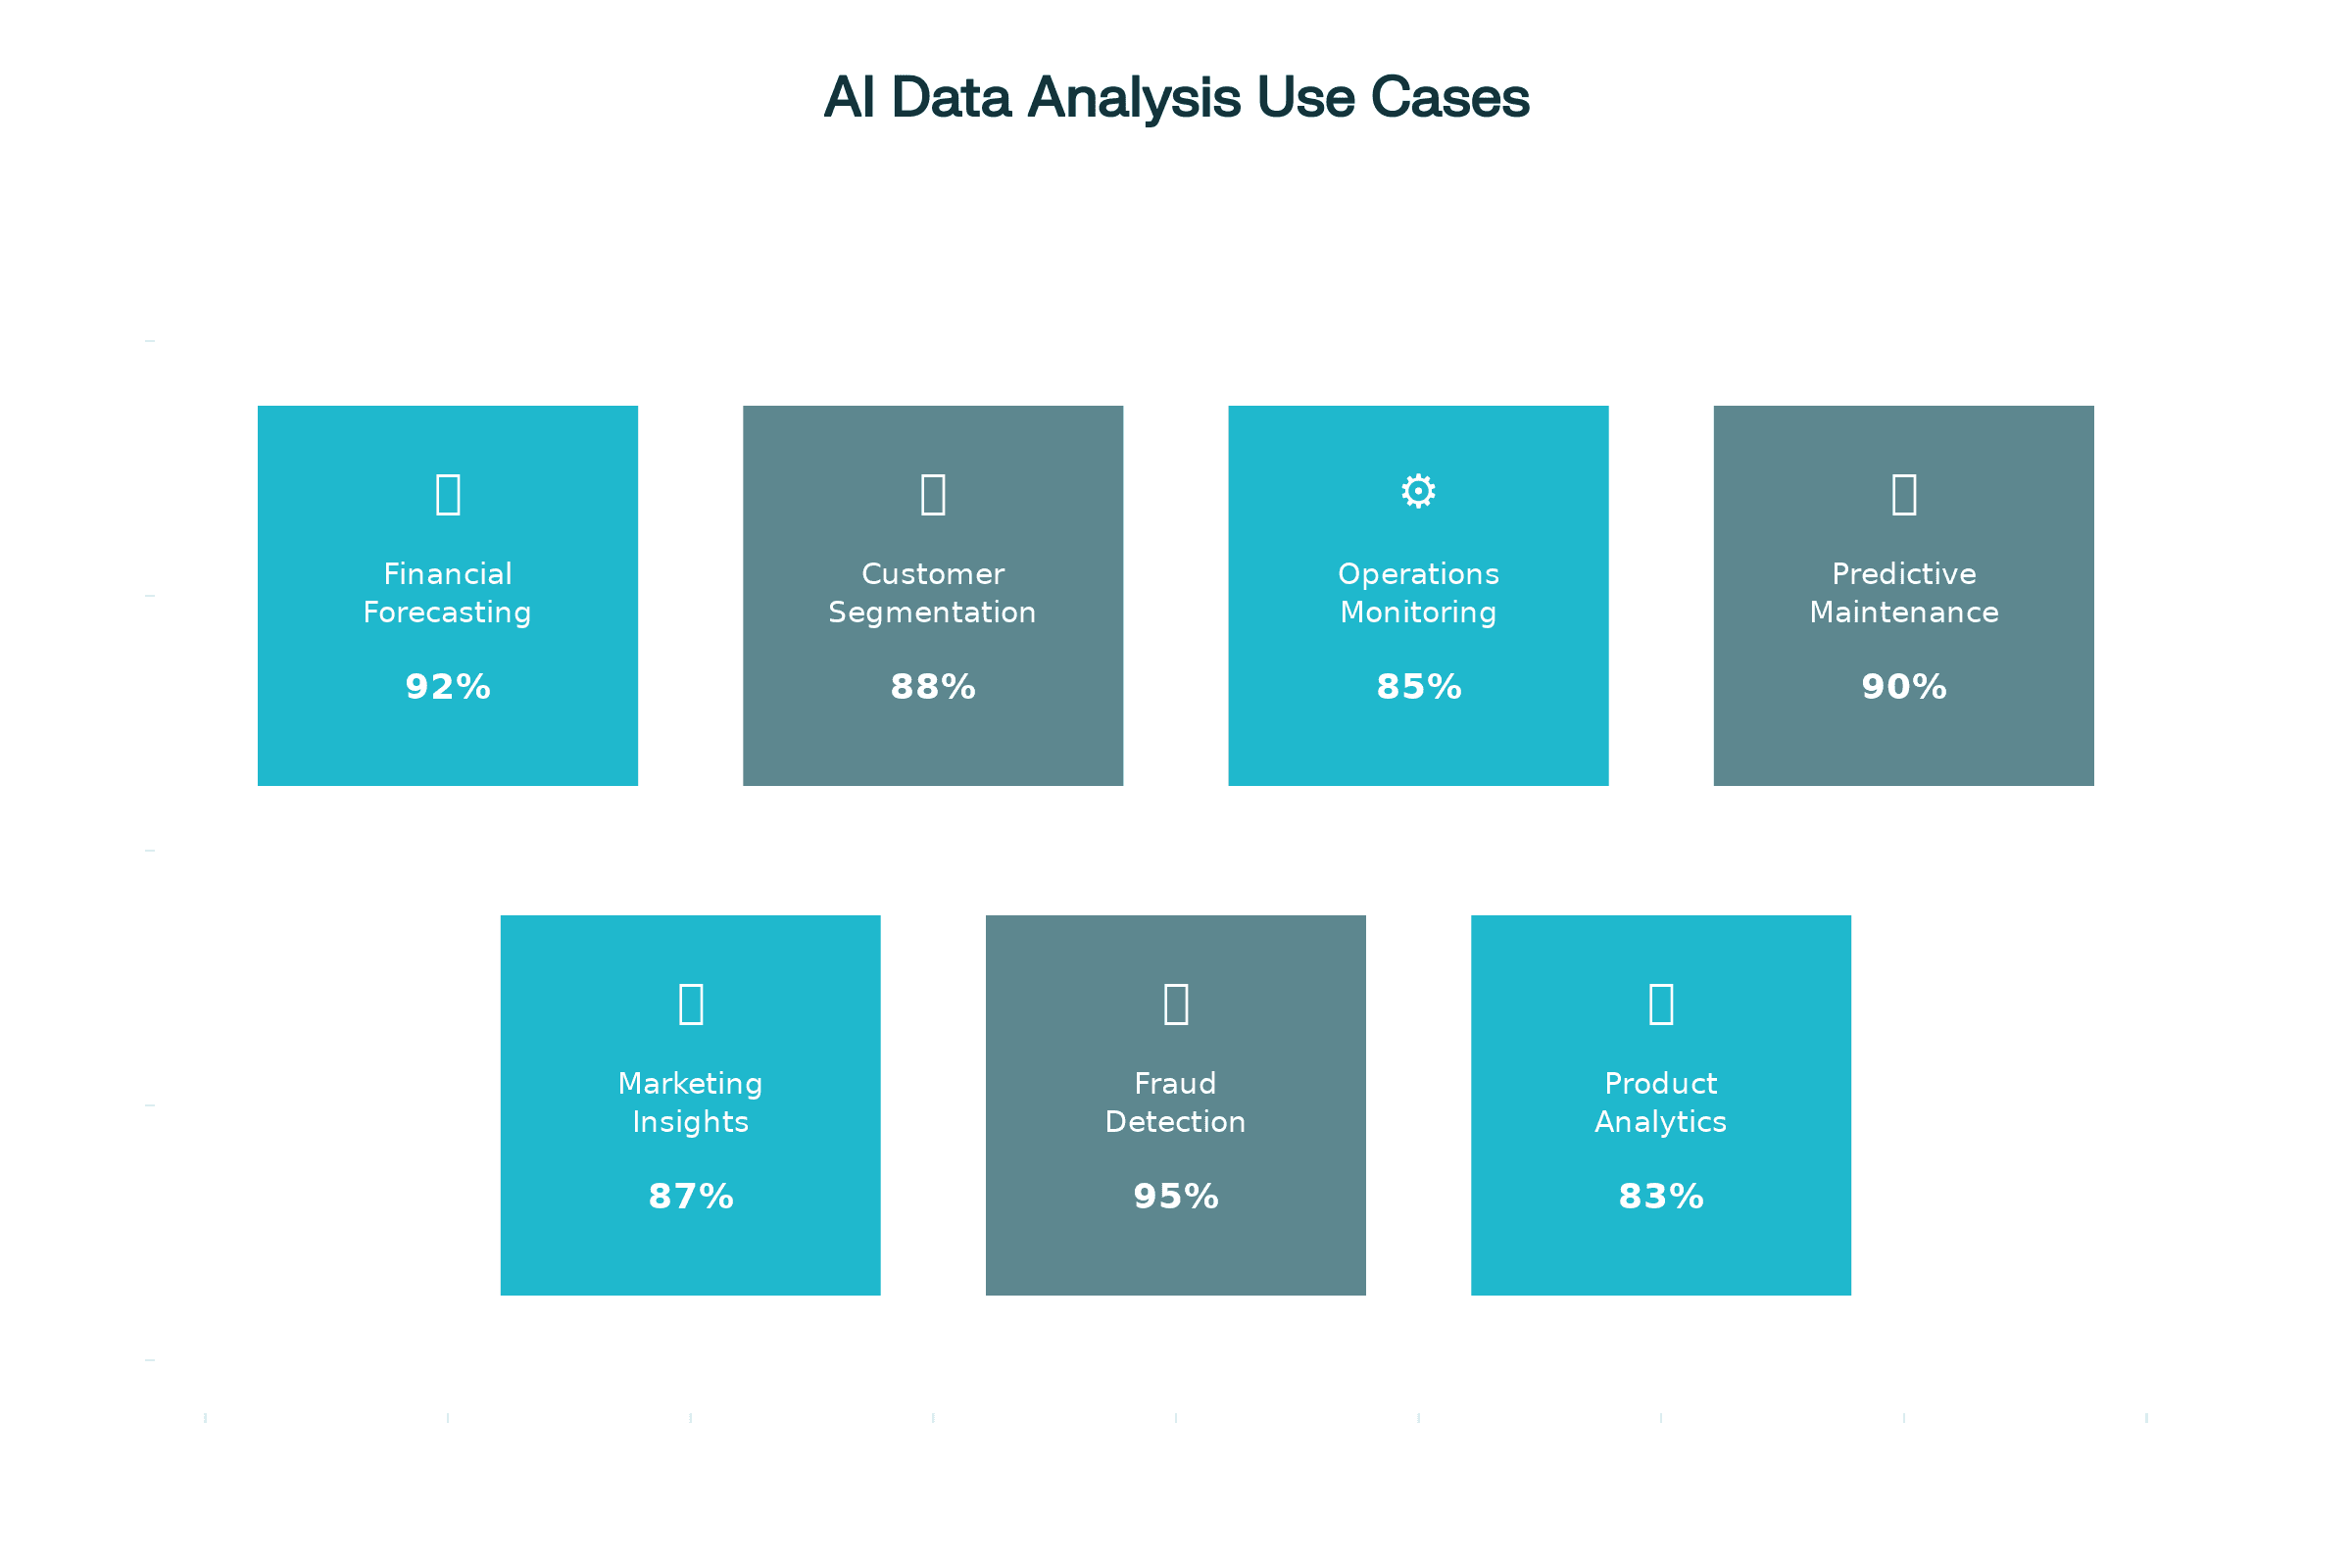
7 AI Data Analysis Use Cases
Financial Forecasting
AI predicts revenue, cash flow, demand, churn with 20–30% lower error.Customer Segmentation
ML clusters customers for targeted marketing, upsell/cross-sell; lifts campaign ROI 2–4x.Operations Monitoring
Real-time anomaly detection in supply chain, sales, or support—reducing downtime and missed SLAs.Predictive Maintenance
For manufacturers/logistics: models pre-empt breakdowns; saves 10–30% in maintenance costs.Marketing Insights
AI optimizes spend, auto-identifies top/worst performing campaigns, and tests new strategies.Fraud Detection
Unsupervised models spot suspicious transactions more accurately and with fewer false positives.Product Analytics
Usage, retention, churn, and feature adoption surfaced without SQL or deep data expertise.
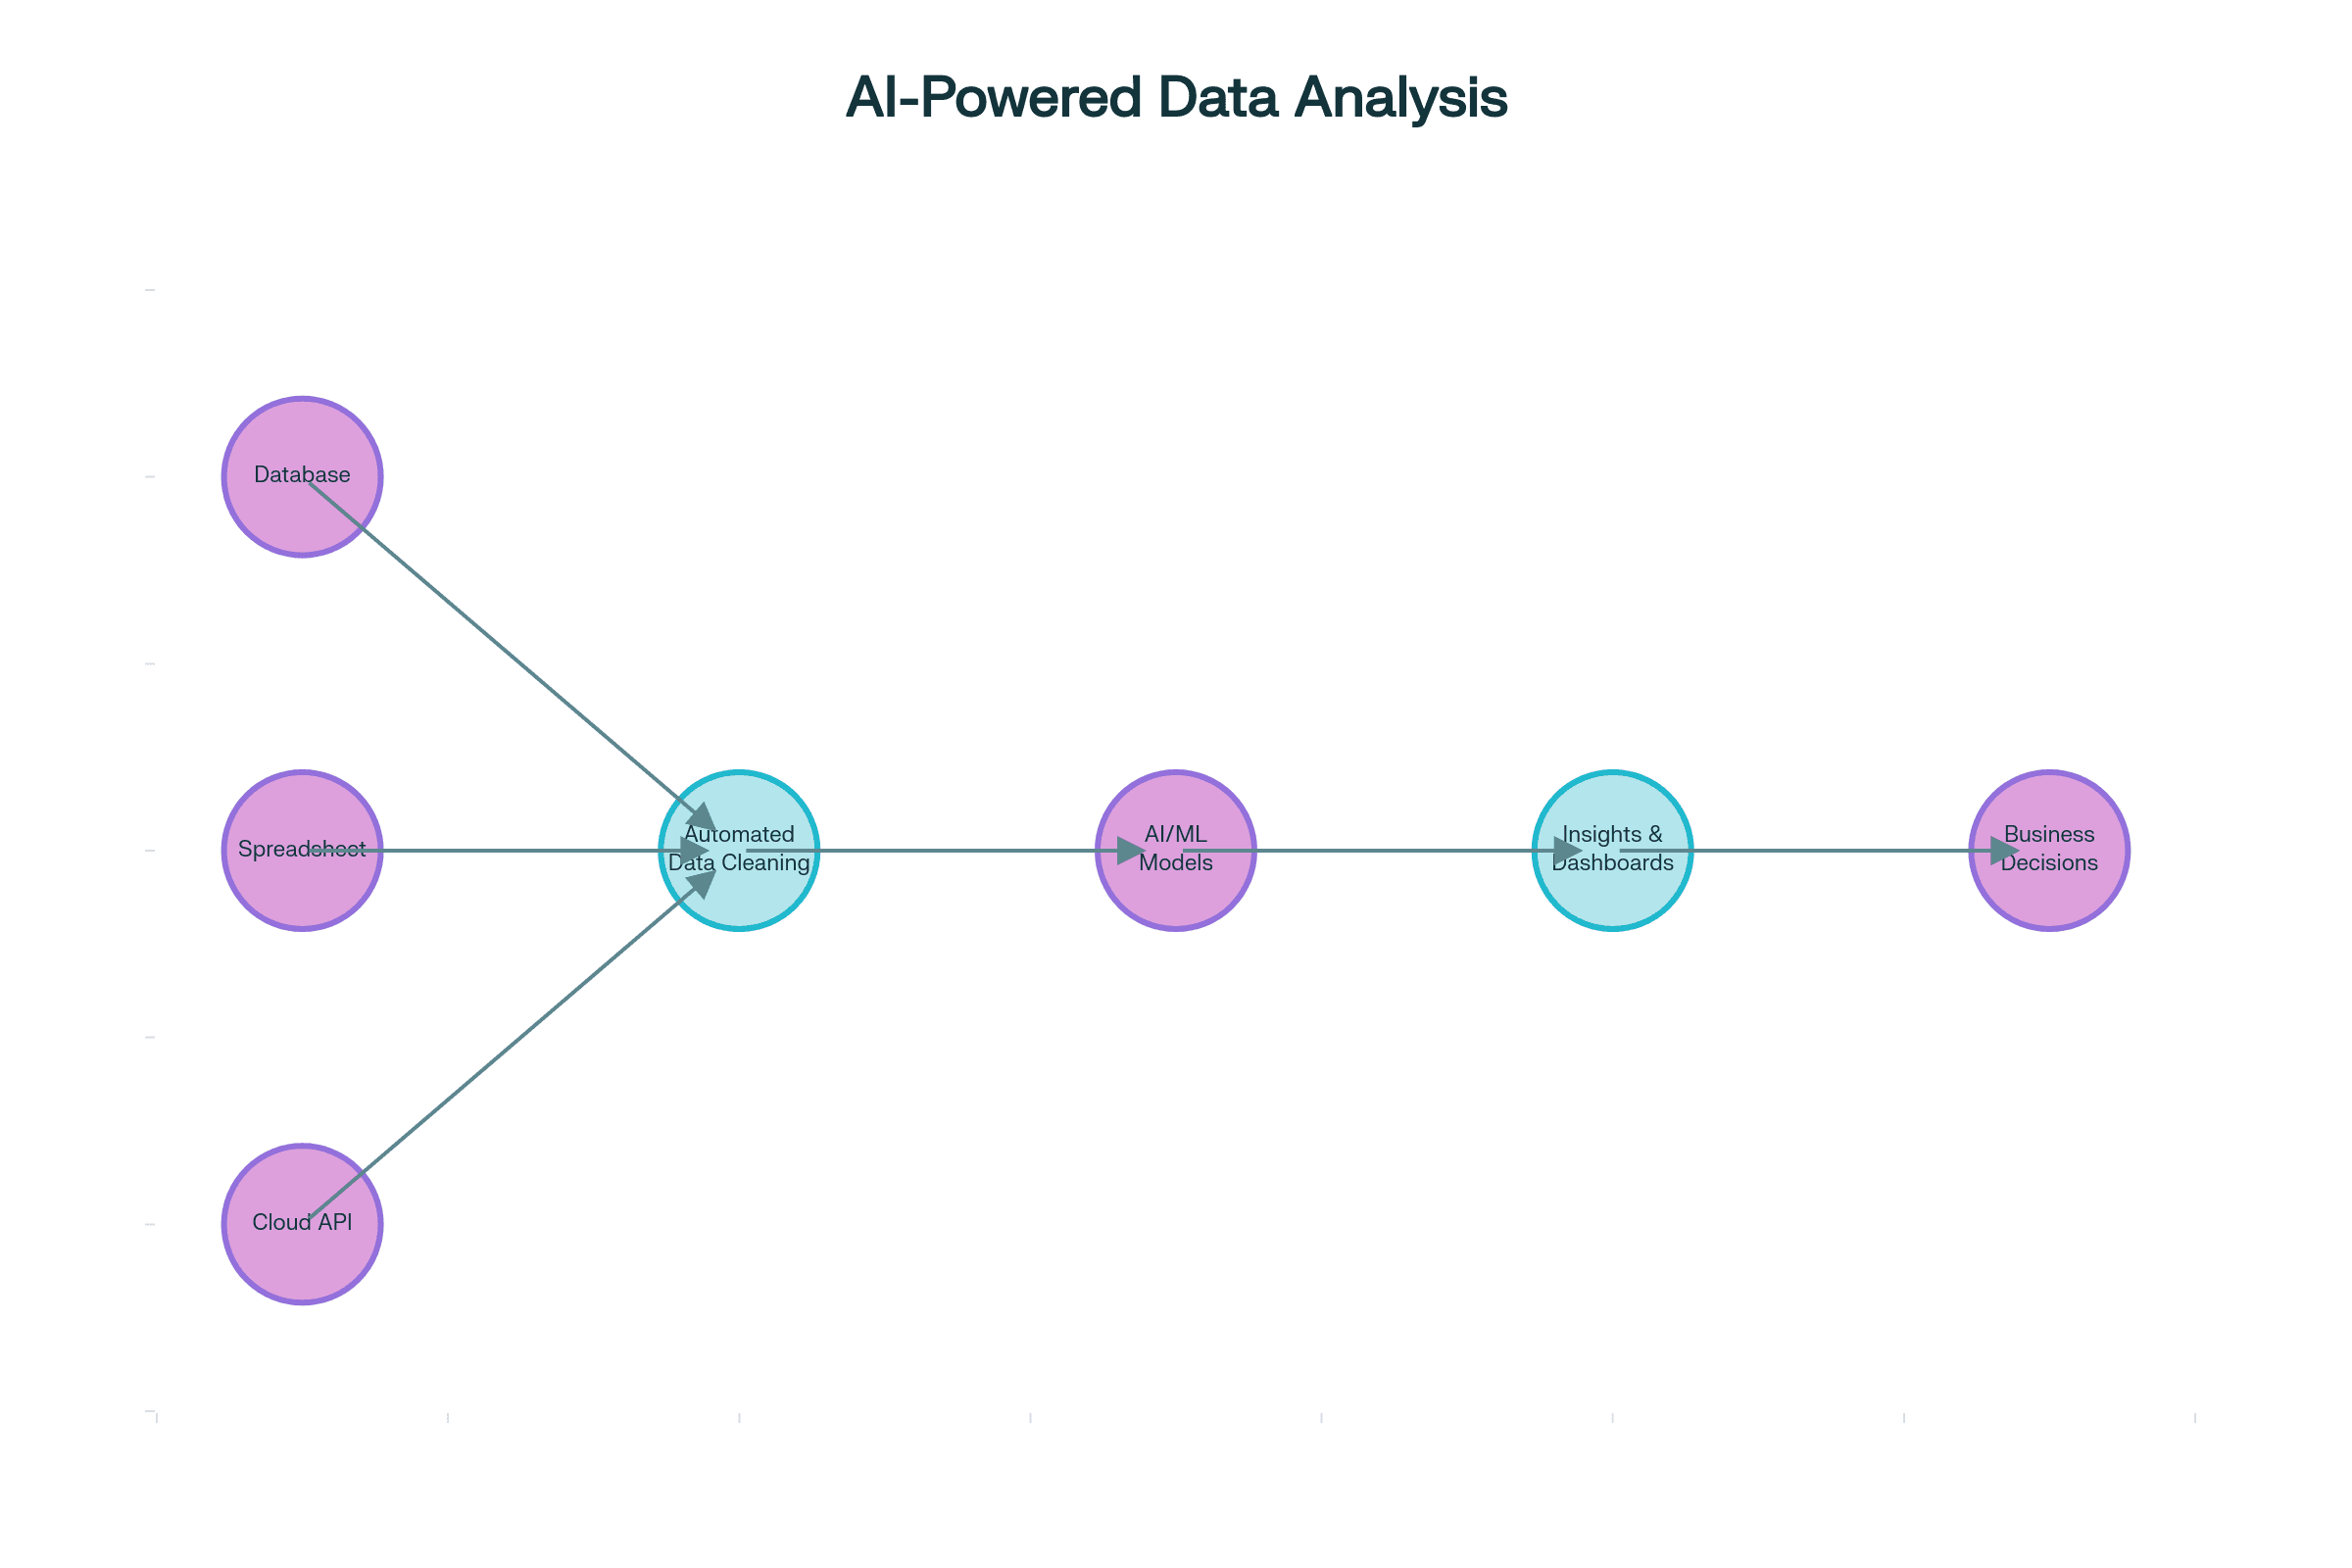
How AI Data Analysis Works
Step 1: Data Integration
Connect to databases, SaaS, spreadsheets, or APIs.
Step 2: Automated Cleaning
AI spots, fills, or removes errors, standardizes values, and preps for modeling.
Step 3: Modeling & Inference
Machine learning/LLMs segment, predict, cluster, forecast, or generate insights—sometimes even with plain language queries.
Step 4: Visualization & Storytelling
Graphs/dashboards auto-generated, insights surfaced in context or narrated for non-technical users.
Step 5: Business Decision
Closed-loop: Insights feed operational systems for action—fully automated.
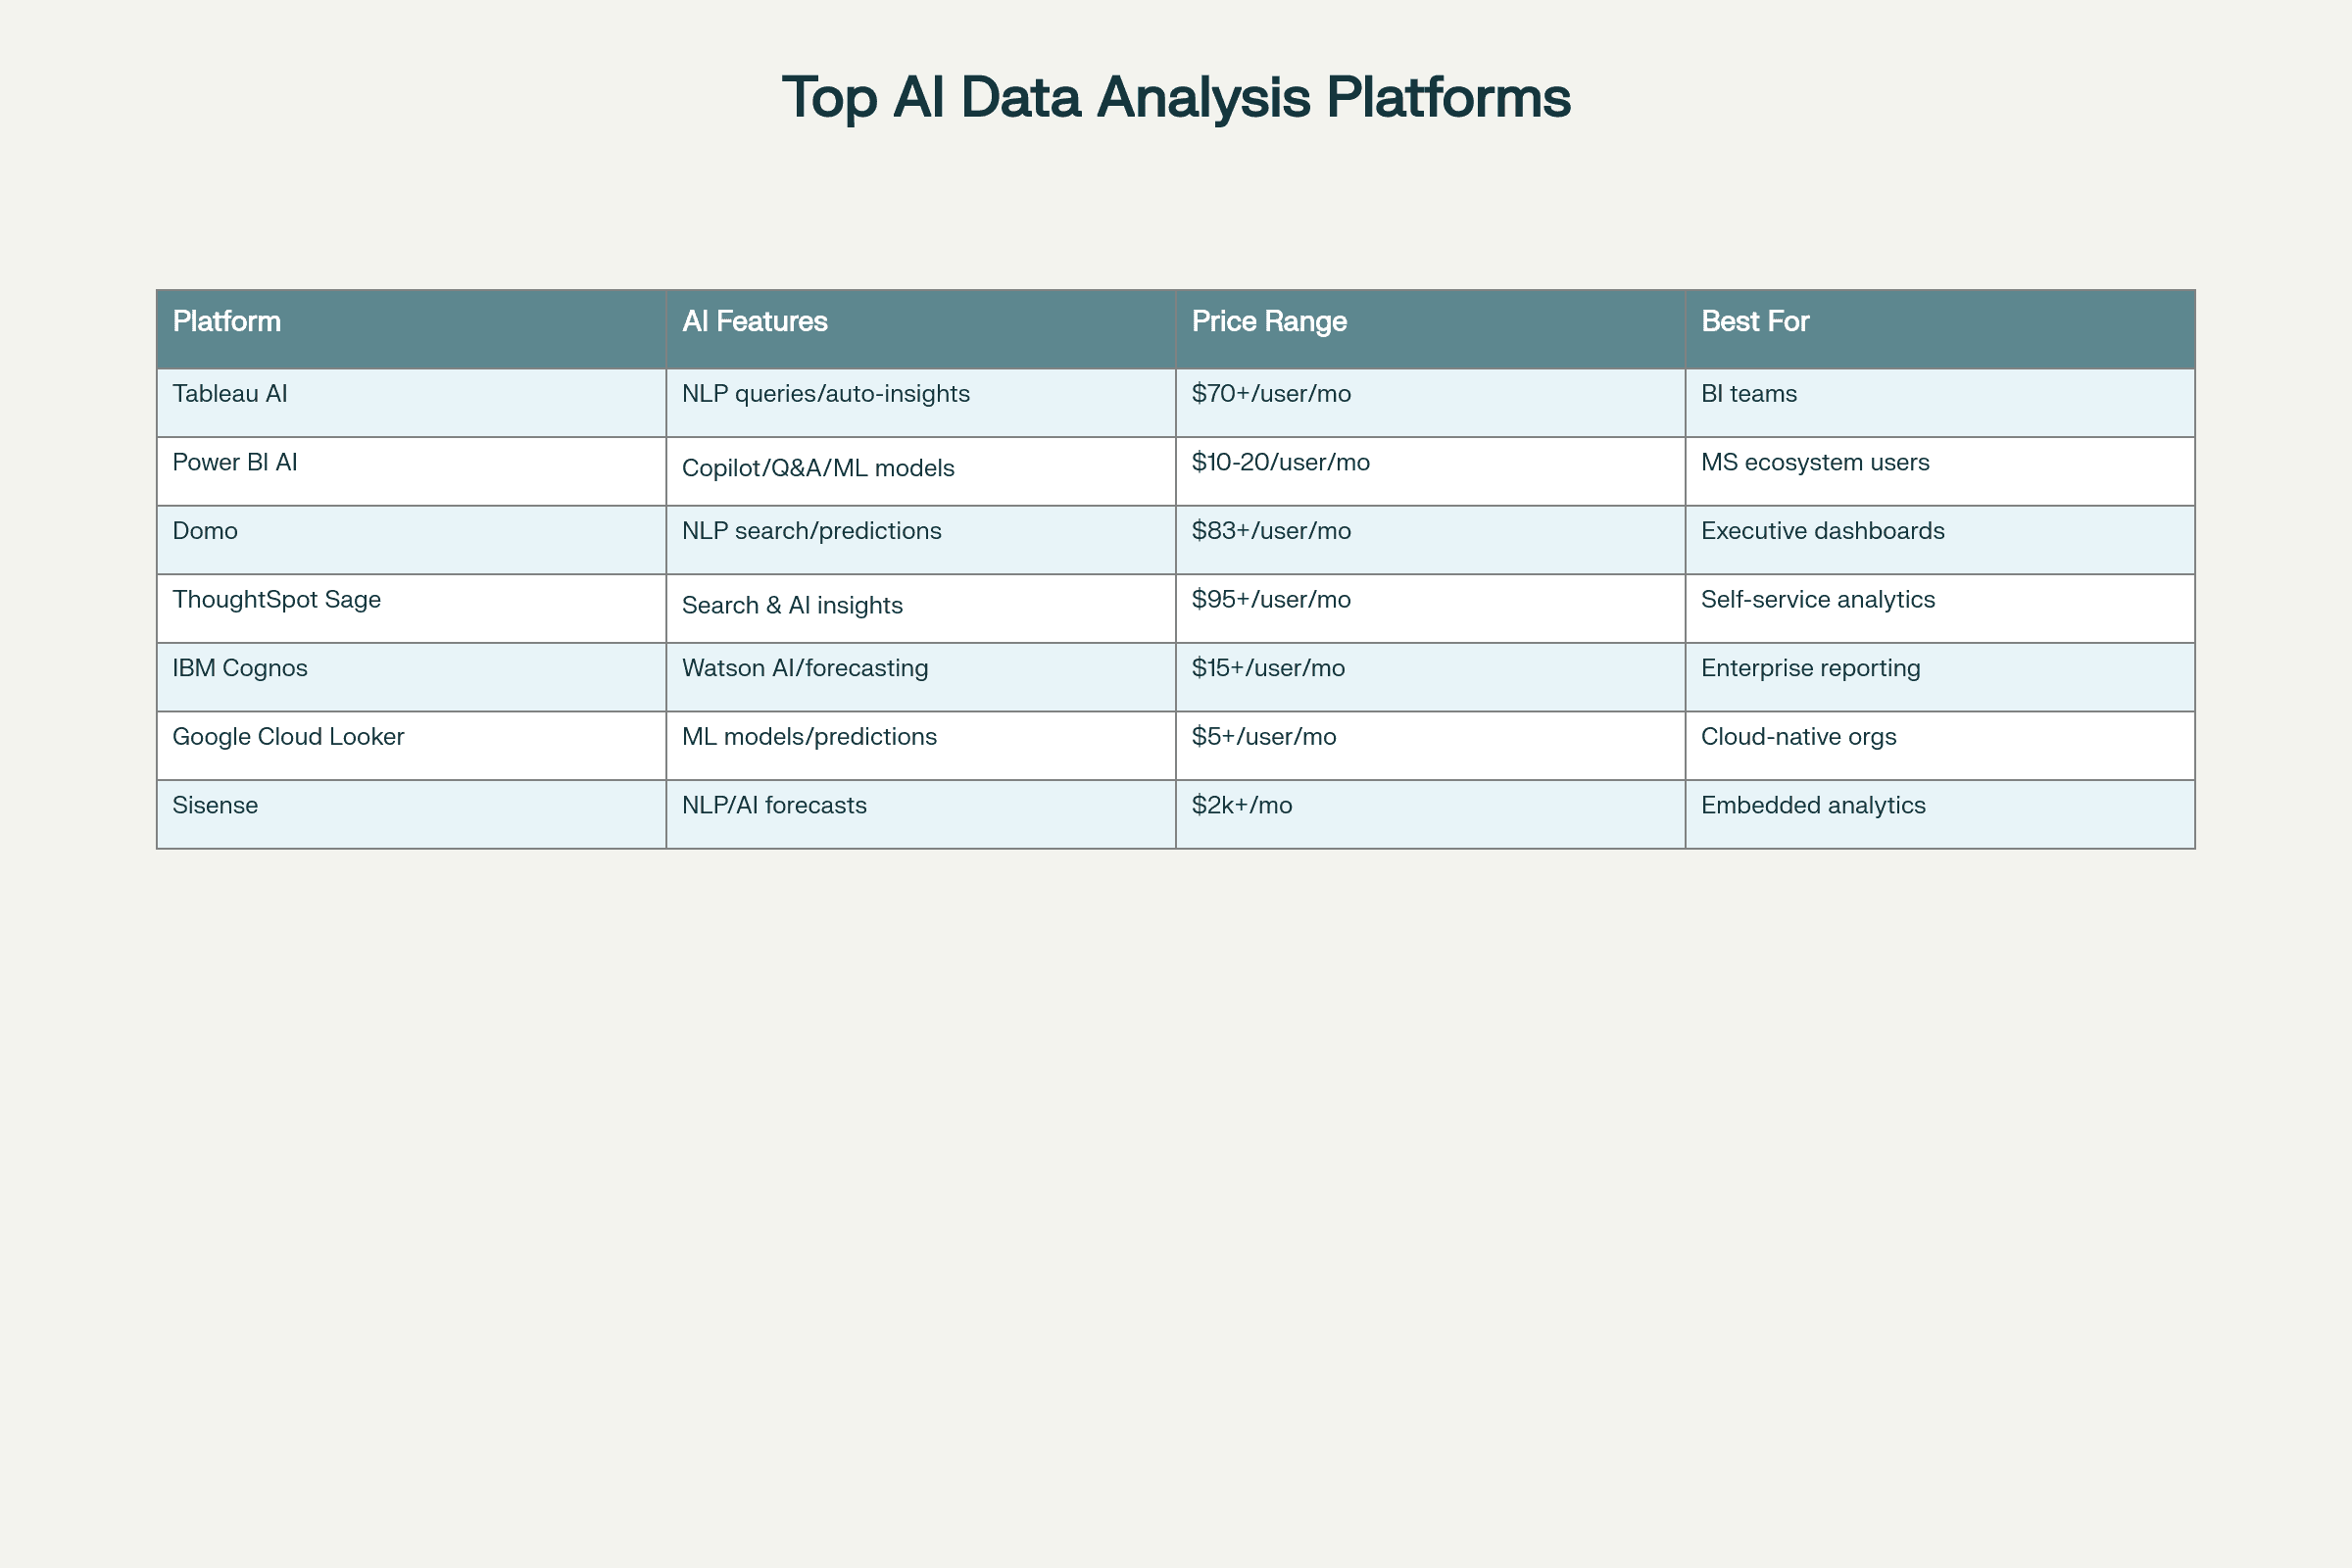
Top Platforms Compared
Platform | AI Features | Price Range | Best For |
|---|---|---|---|
Tableau AI | NLP queries, auto-insights, explain | $70+/user/mo | BI teams, enterprises |
Power BI AI | Smart narratives, Auto ML, Copilot | $10–20/user/mo | MS shops, SMB/large |
Domo | Auto-modeling, integrated AI, alerts | $95+/user/mo | Real-time ops, cloud |
ThoughtSpot Sage | AI Search, LLM insights | $95+/user/mo | Ad hoc, LLM queries |
IBM Cognos | ML modeling, anomaly detection | Custom | Reg/co. compliance |
Google Looker | AI predictions, BigQuery native | $60+/user/mo | Data engineering, GCP |
Sisense | Embedded AI, NLQ, extensible API | Custom | SaaS, embedded BI |
Most tools now bake in AI for insight, but differ in depth, flexibility, and LLM support. Integrate with your data stack for best results.
Implementation Roadmap
Weeks 1–2: Audit & Planning
Inventory data sources; review privacy/cleanliness/completeness.
Define end goals—what business problems are you aiming to solve?
Select pilot use case.
Weeks 3–4: Platform Selection
Demo top tools with sample data.
Assess integration, cost, security, and skill fit.
Set up credentials, pipelines, and storage.
Weeks 5–6: Data Preparation & Model Building
Clean/label sample data, set up auto-clean jobs.
Deploy out-of-the-box ML models.
Test results with edge cases, iterate.
Weeks 7–8: Visualization & Action
Build and share dashboards.
Automate workflow to trigger actions (alerts, emails, ops systems).
Train user teams on new analytics/AI flows.
Weeks 9–10: Launch & Optimize
Go live with select business unit.
Monitor ROI & issues.
Expand based on feedback month by month.
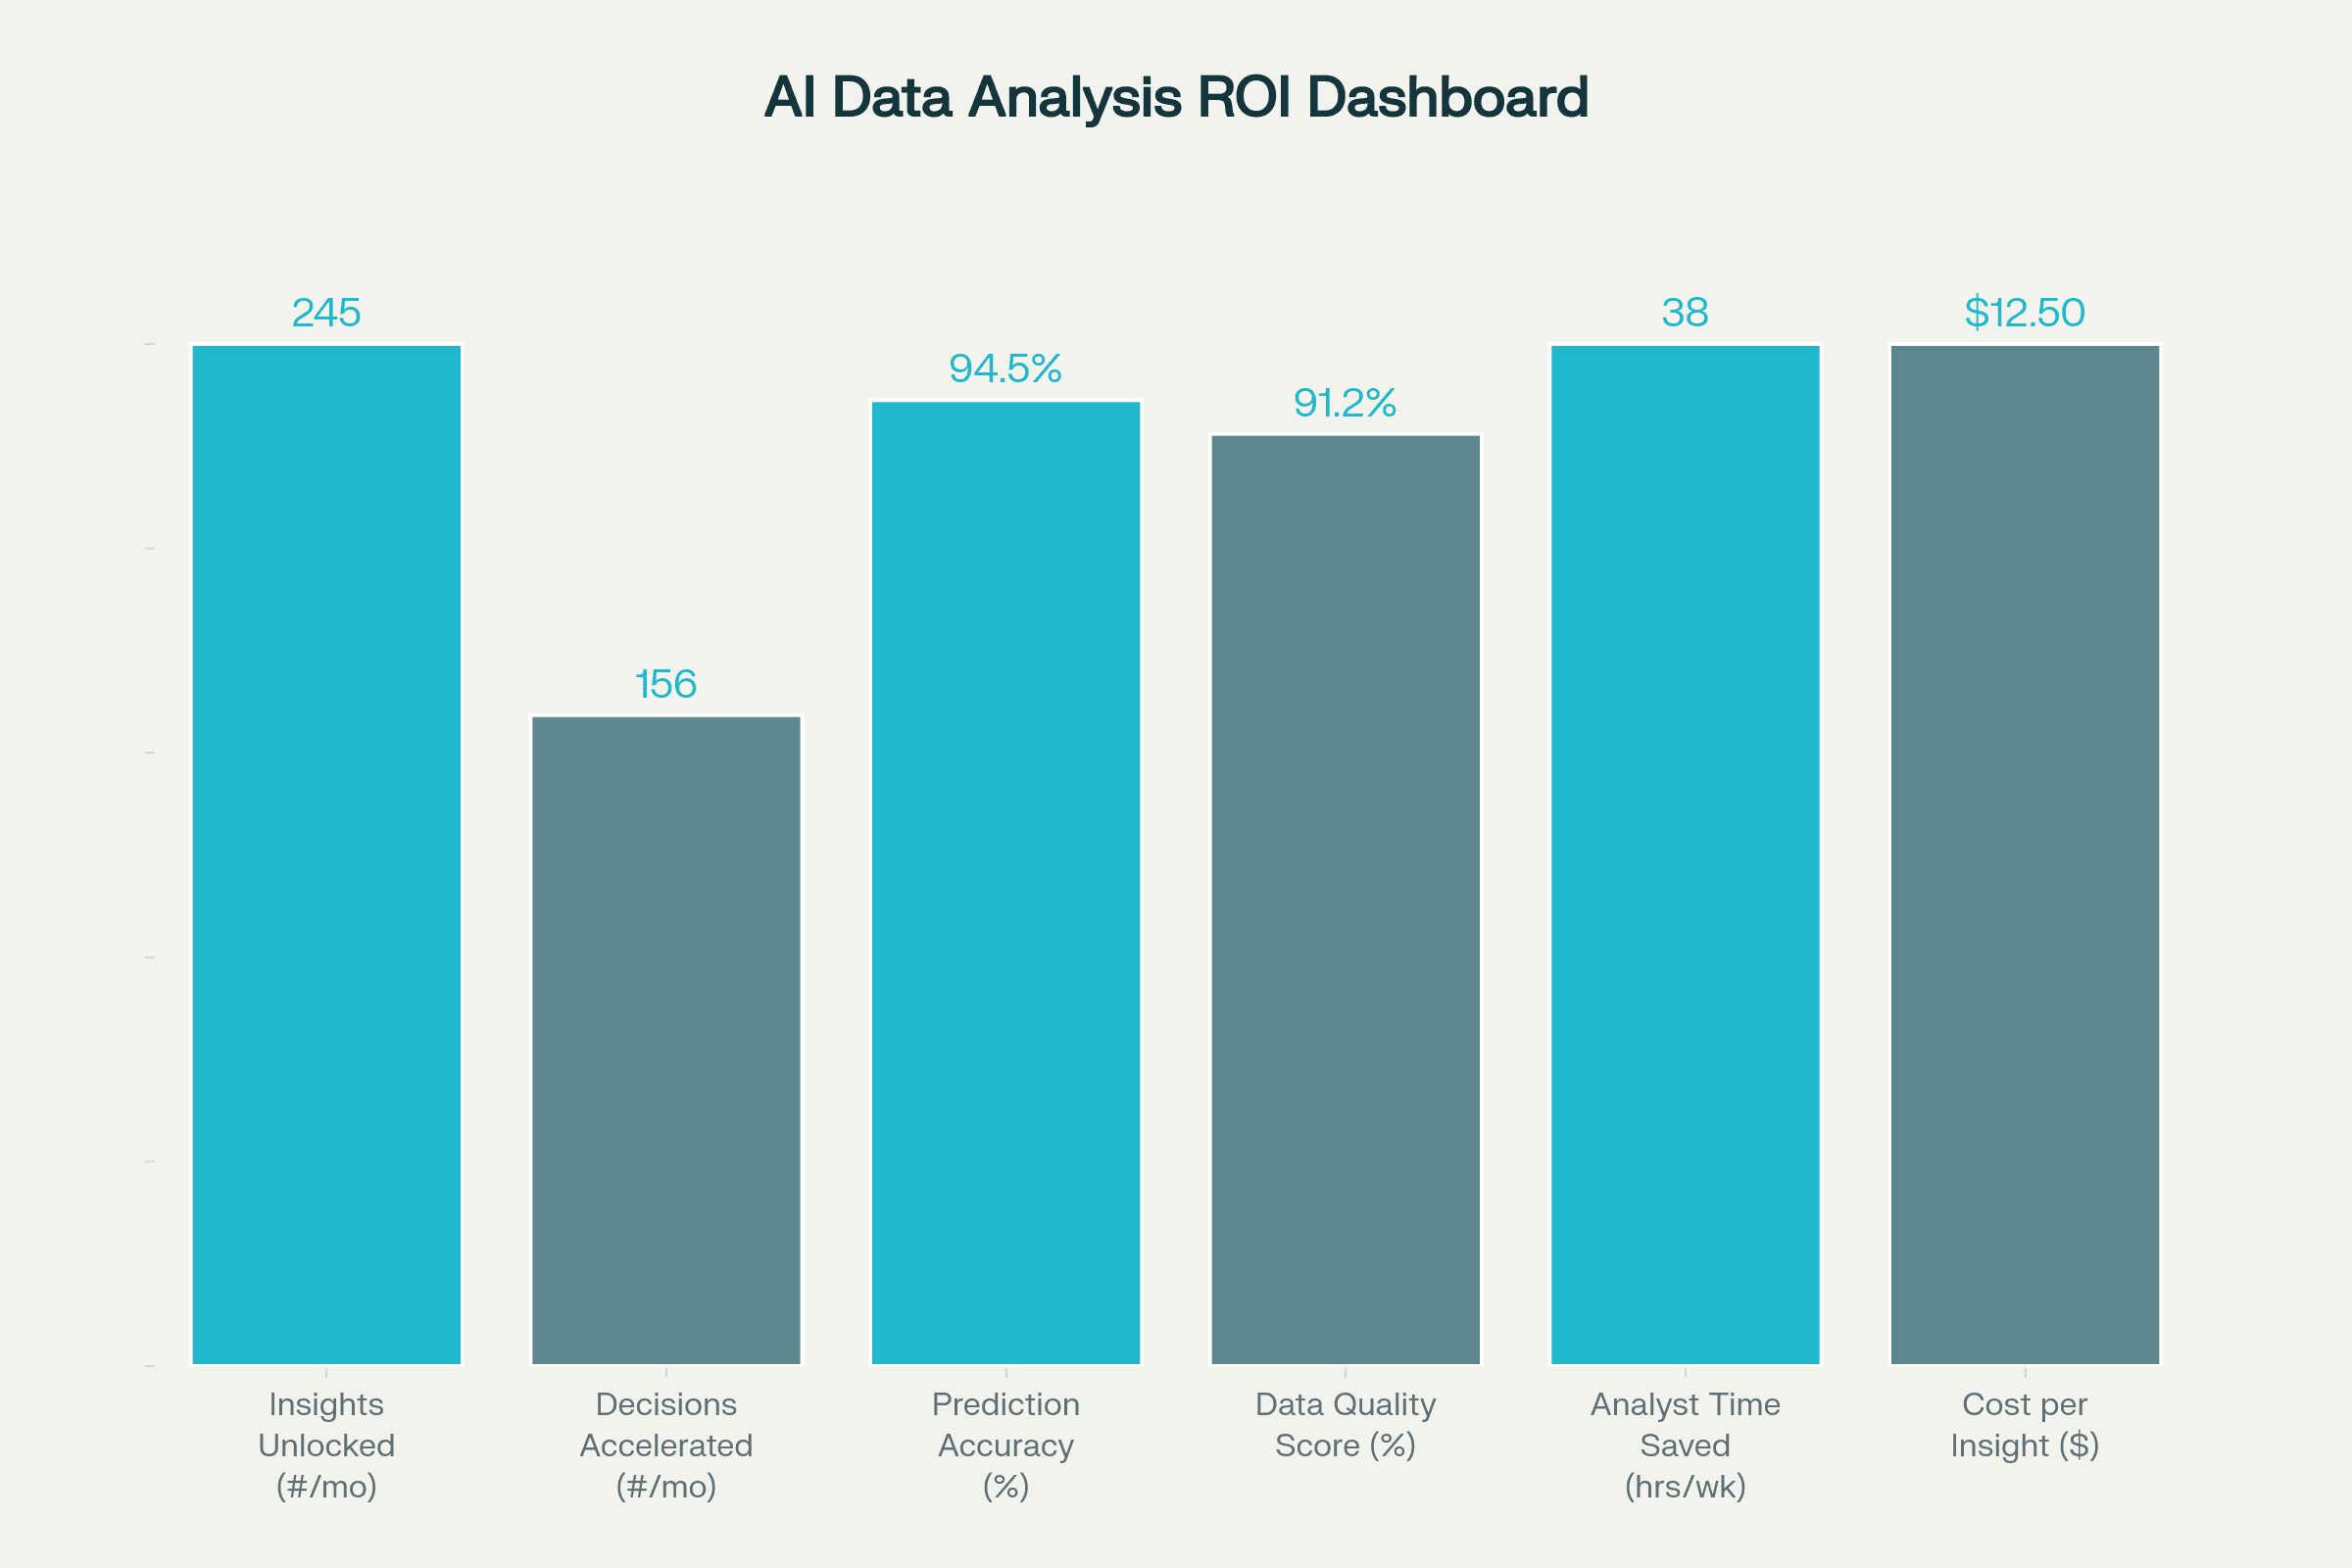
KPIs, ROI, and Success Stories
Track These:
Insights Unlocked (#/mo): # actionable findings per month.
Analyst Time Saved (hrs/wk): Target 30–60% reduction.
Prediction Accuracy (%): Key for forecasts, outlier detection.
Data Quality Score: % clean/usable after AI prep.
Decisions Accelerated: # new or speedier business decisions as a result.
Cost per Insight ($): Down year-over-year.
Sample Results:
A $200M retail chain saved 22 analyst-days/month after AI rollout.
SaaS company grew NPS by 31 points by segmenting and fixing high-churn cohorts, uncovered via LLM-driven analysis.
Public company board reports produced in 1/3rd the time, auto-narrated and visualized by AI.
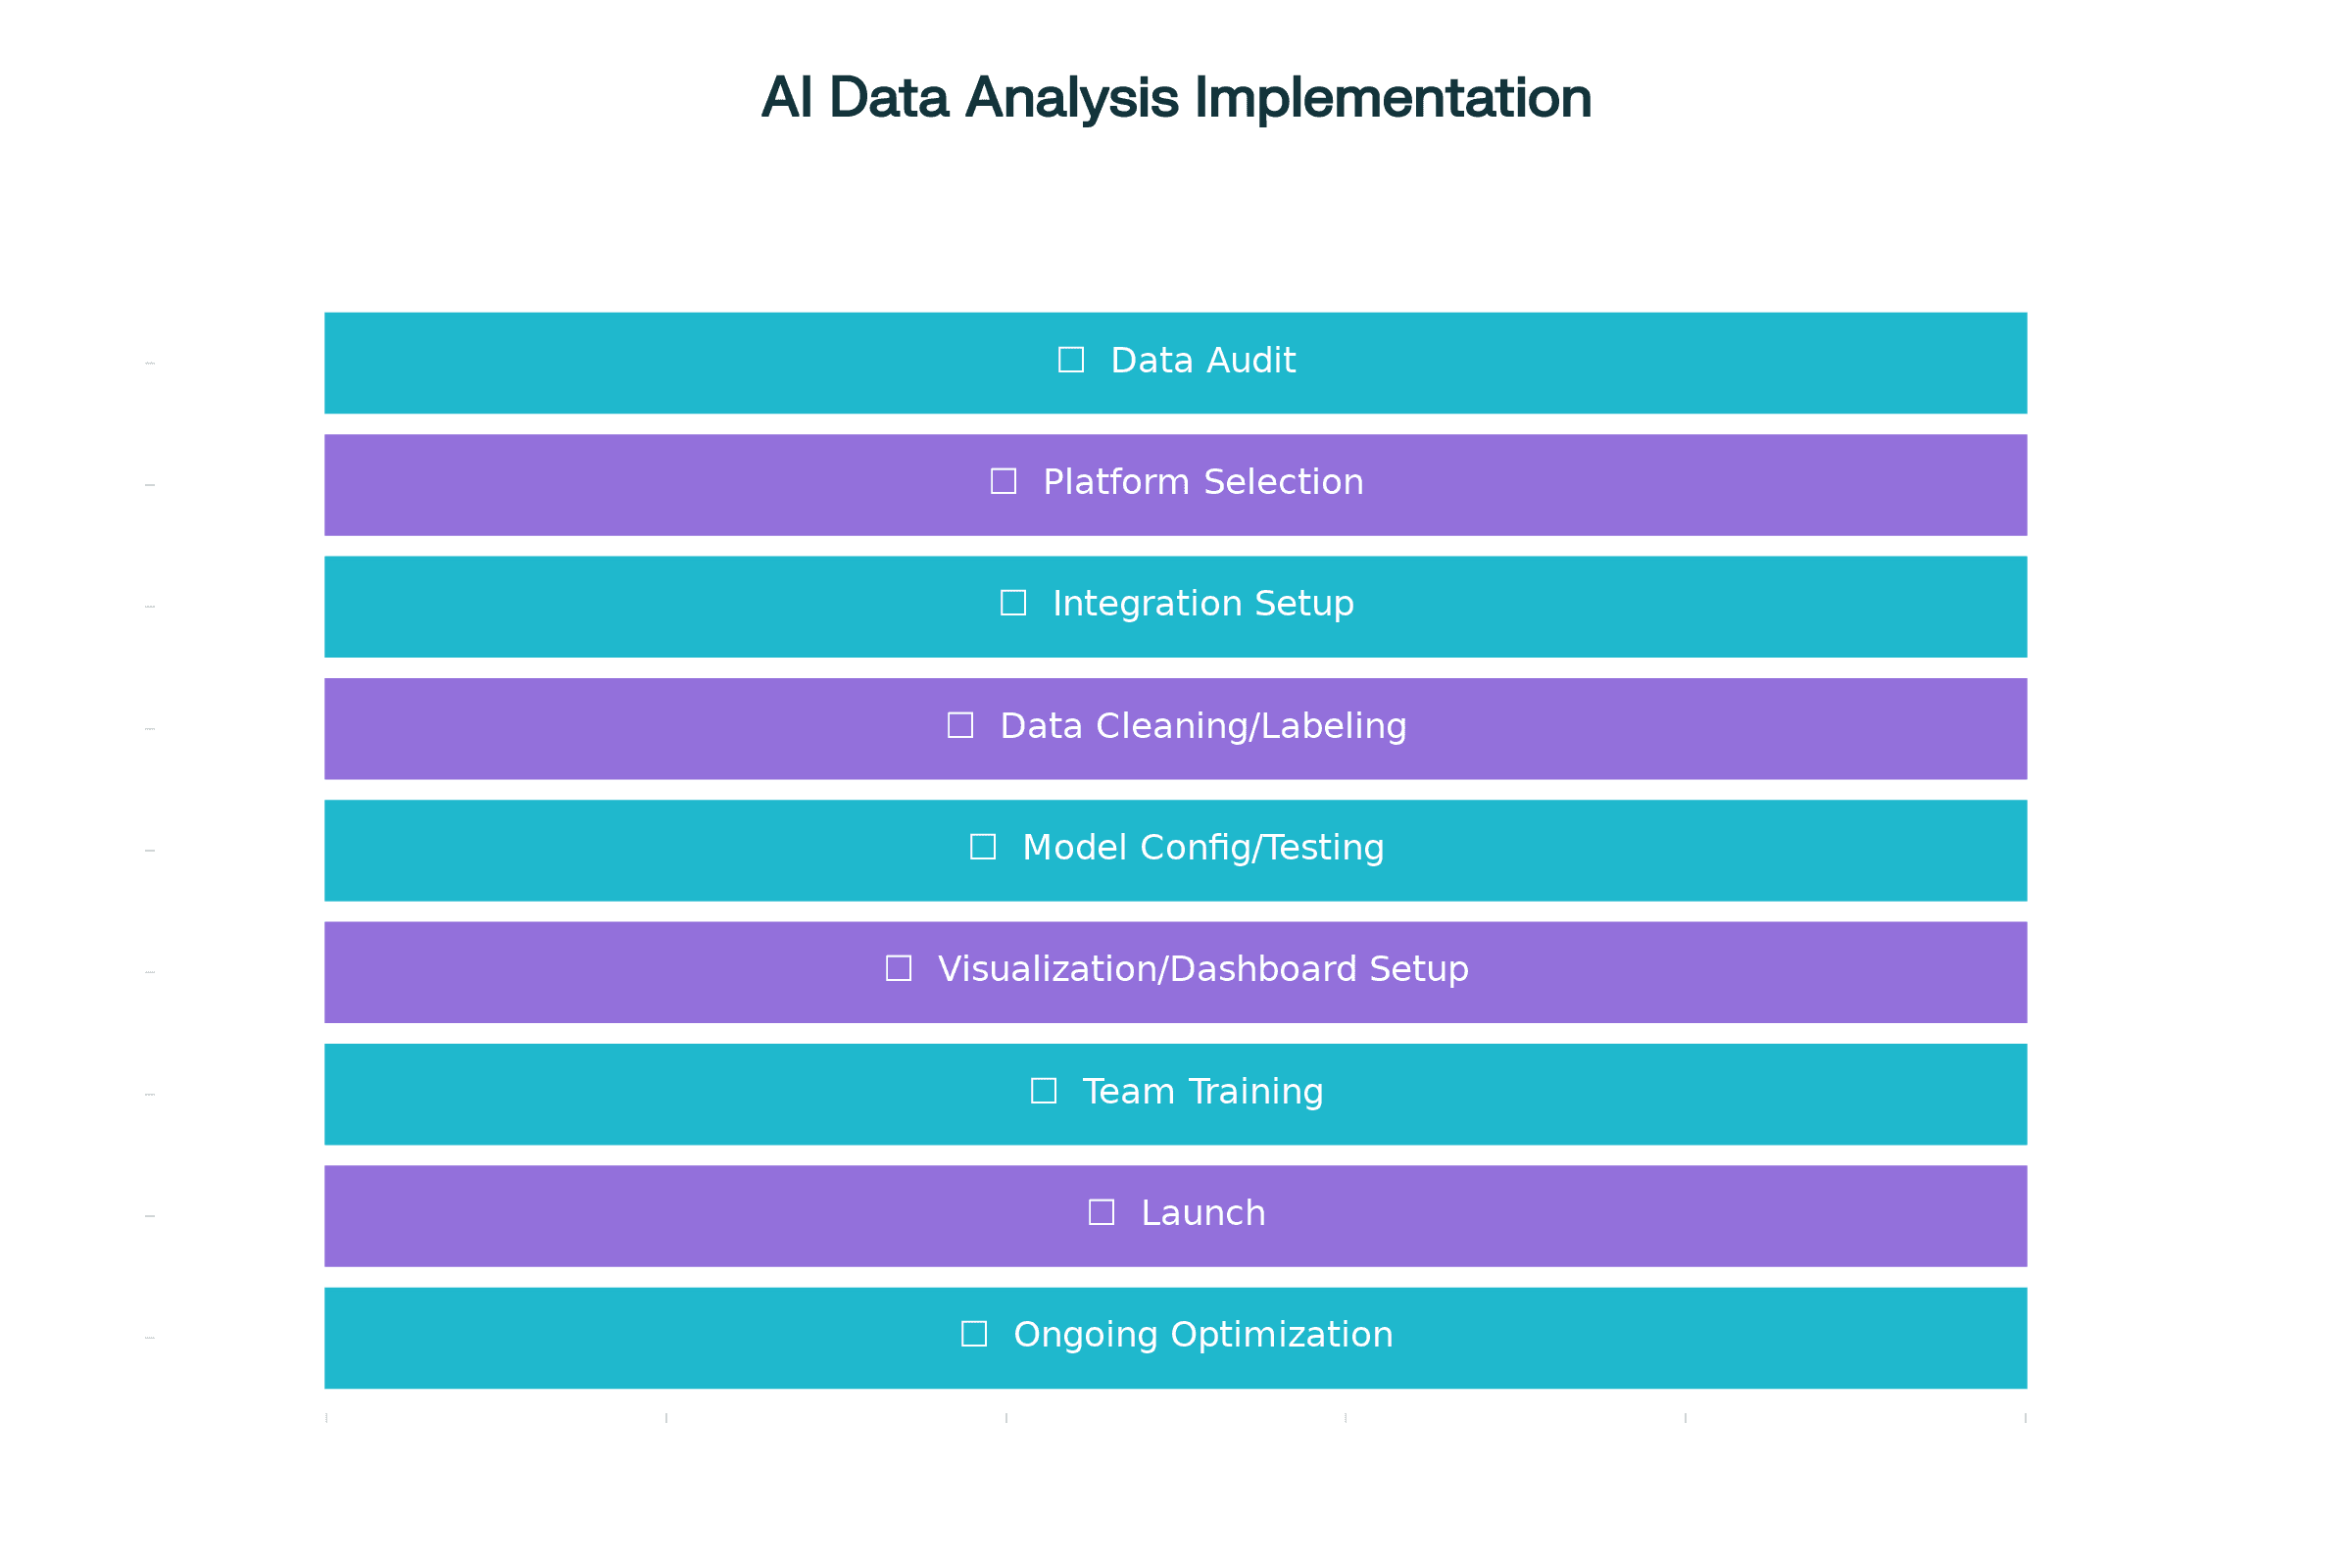
Checklist for AI Data Analysis Adoption
Audit data sources and security/privacy readiness
Choose pilot use case with clear business ROI
Demo short-list platforms, evaluate cost/flexibility
Prepare, clean, and label training data
Set up integrations/workflows
Deploy first AI models, refine with results
Develop dashboards and share with stakeholders
Train teams on workflows and interpretation
Launch, track KPIs, and iterate for optimization
Conclusion
AI-driven data analysis is the least “nice to have” and most impact-driving upgrade you can deploy in 2025.
Let AI surface hidden patterns, free your analysts, and turn every business unit into a data powerhouse.
Act on facts, not intuition—and let smart analytics power your winning moves.