Article
Nov 13, 2025
AI ROI Calculator 2025: Measure Real Impact
Calculate AI project ROI accurately. Framework, formulas, benchmarks. Prove value to stakeholders.

Table of Contents
Introduction
AI ROI: Why It Matters
2025 AI ROI Numbers & Challenges
How to Calculate AI ROI (Framework)
ROI by Project Type
Live Metrics & Executive Dashboards
Implementation Checklist
Conclusion
Introduction
AI deployments are surging, but most leaders struggle to answer the core CFO question:
“What’s the return on our AI investment?”
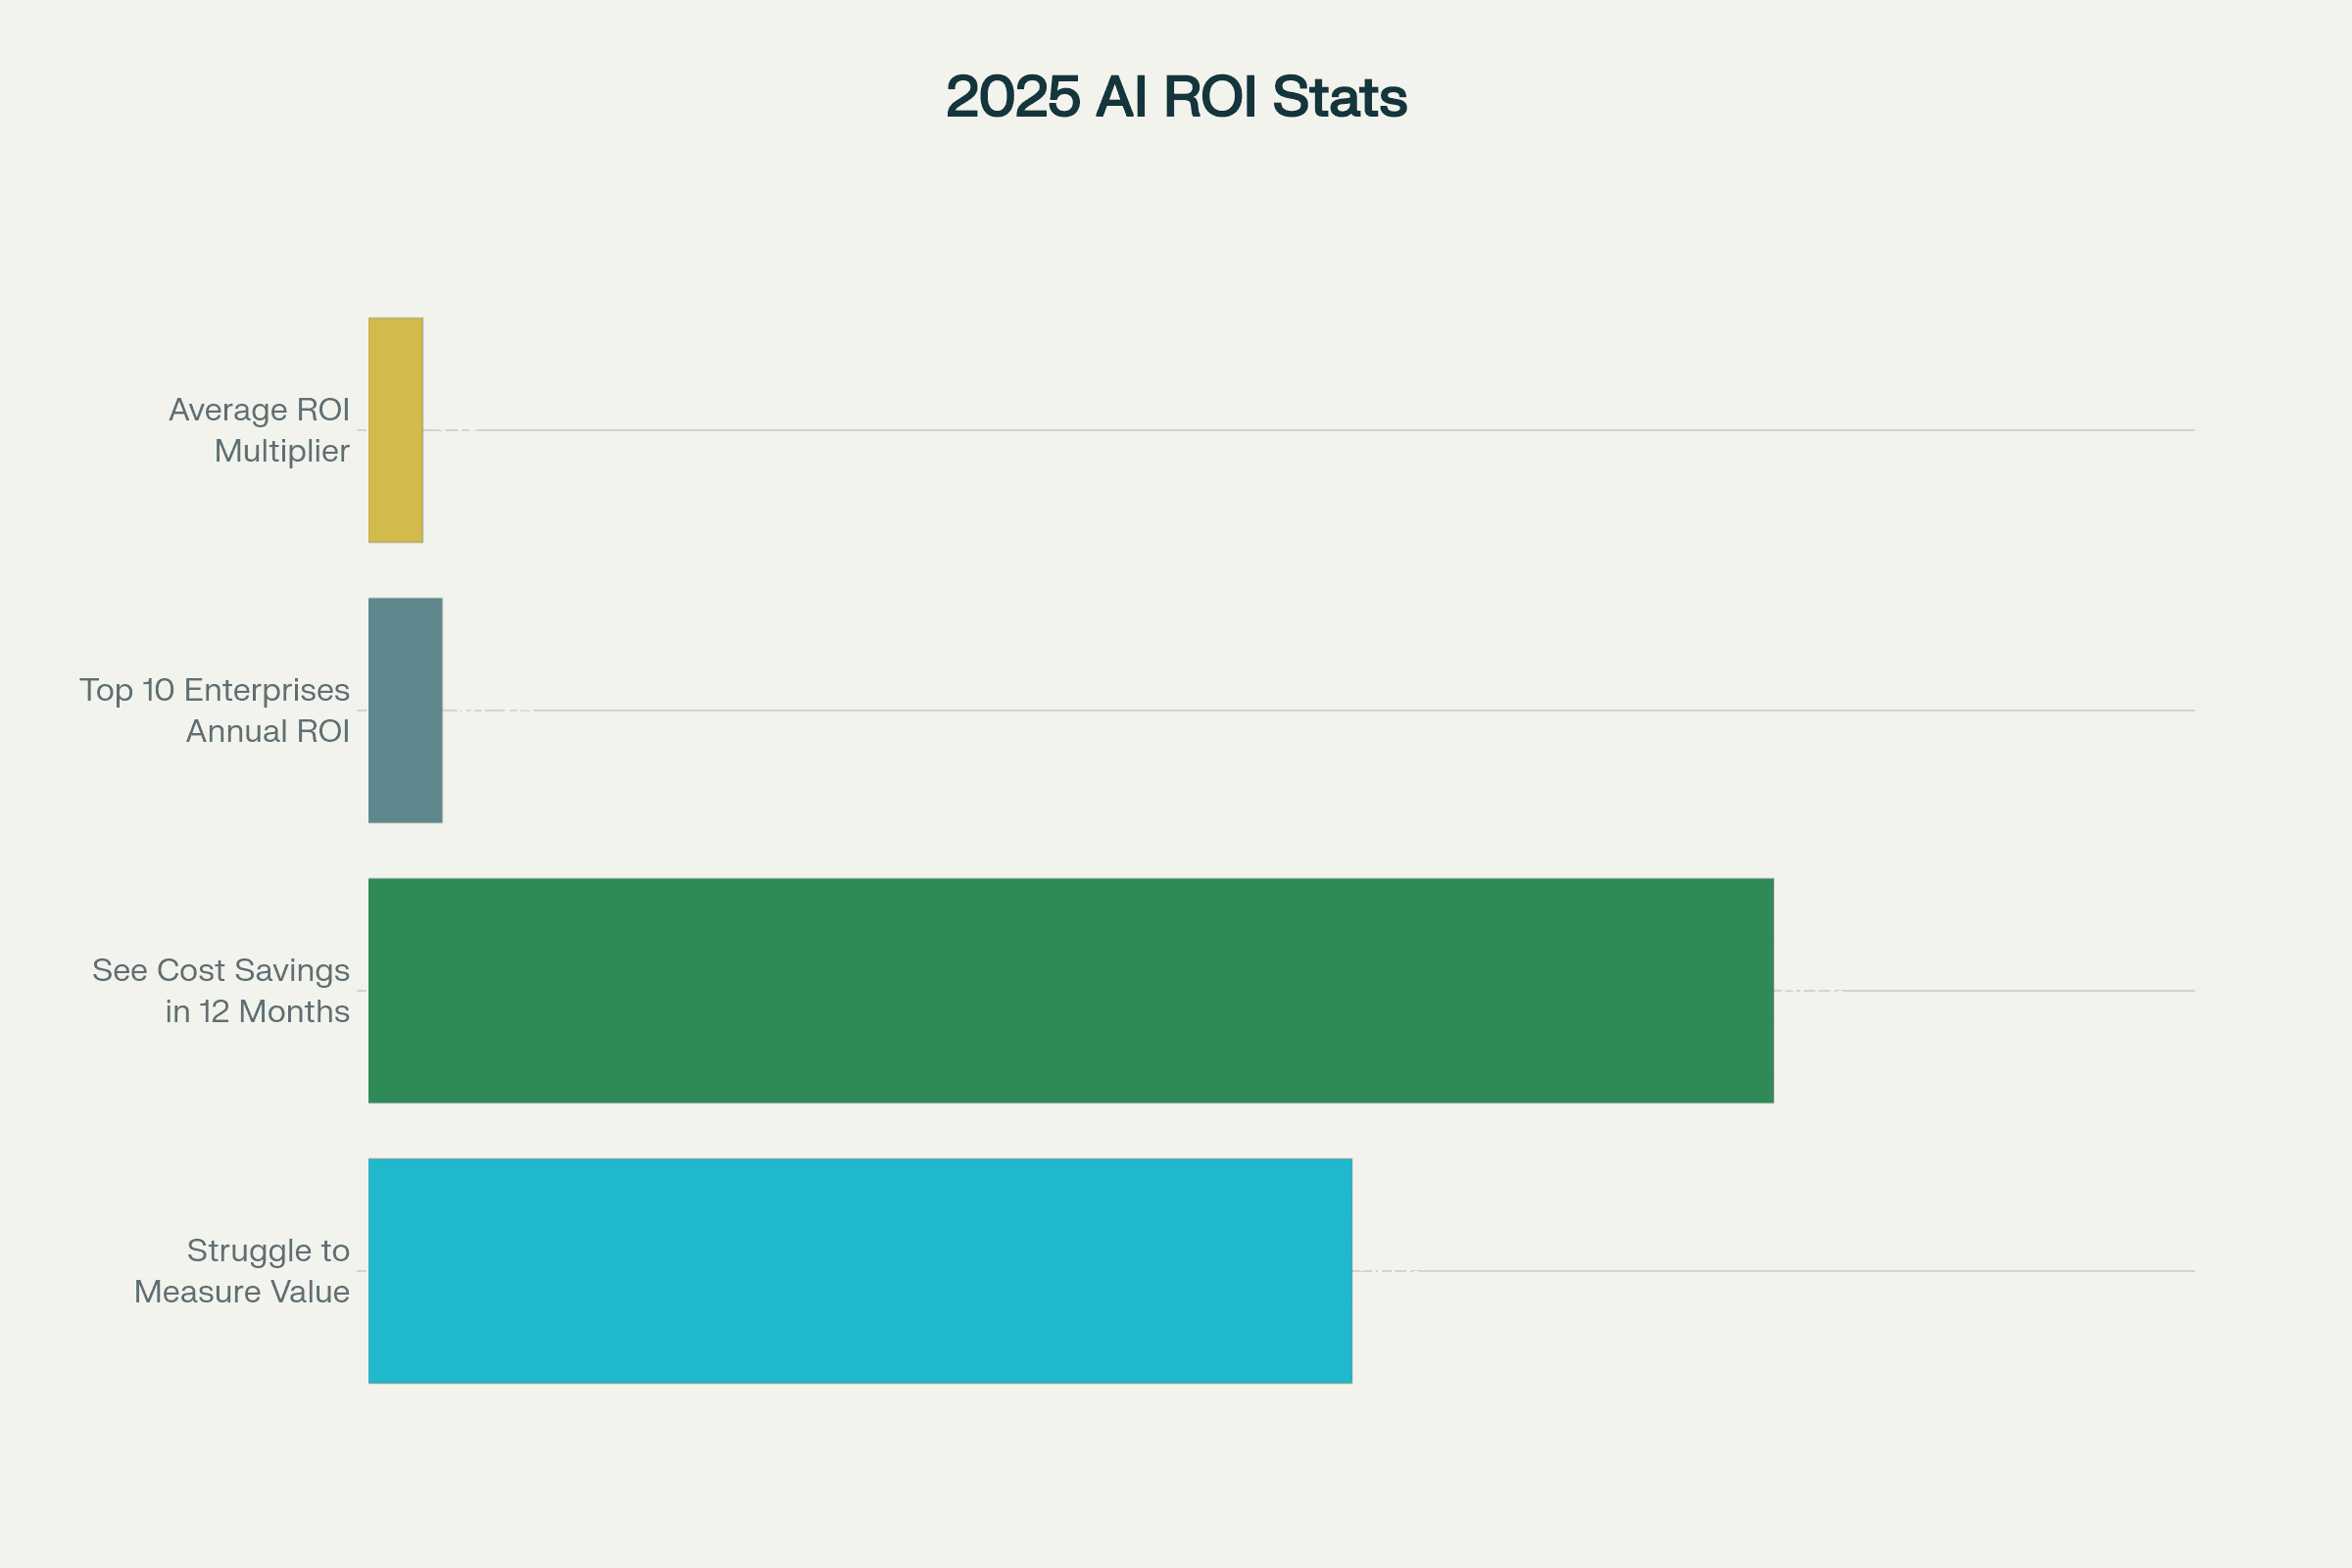
56% of organizations can’t quantify AI’s value
Top 10 enterprises report $4.2Bn/yr average annual AI ROI
80% realize cost savings within 12 months
Median ROI is still 3.1x (but huge variance by use case)
This guide gives you the toolkit, formulas, and common benchmarks for proving—without a doubt—the business impact of your AI projects.
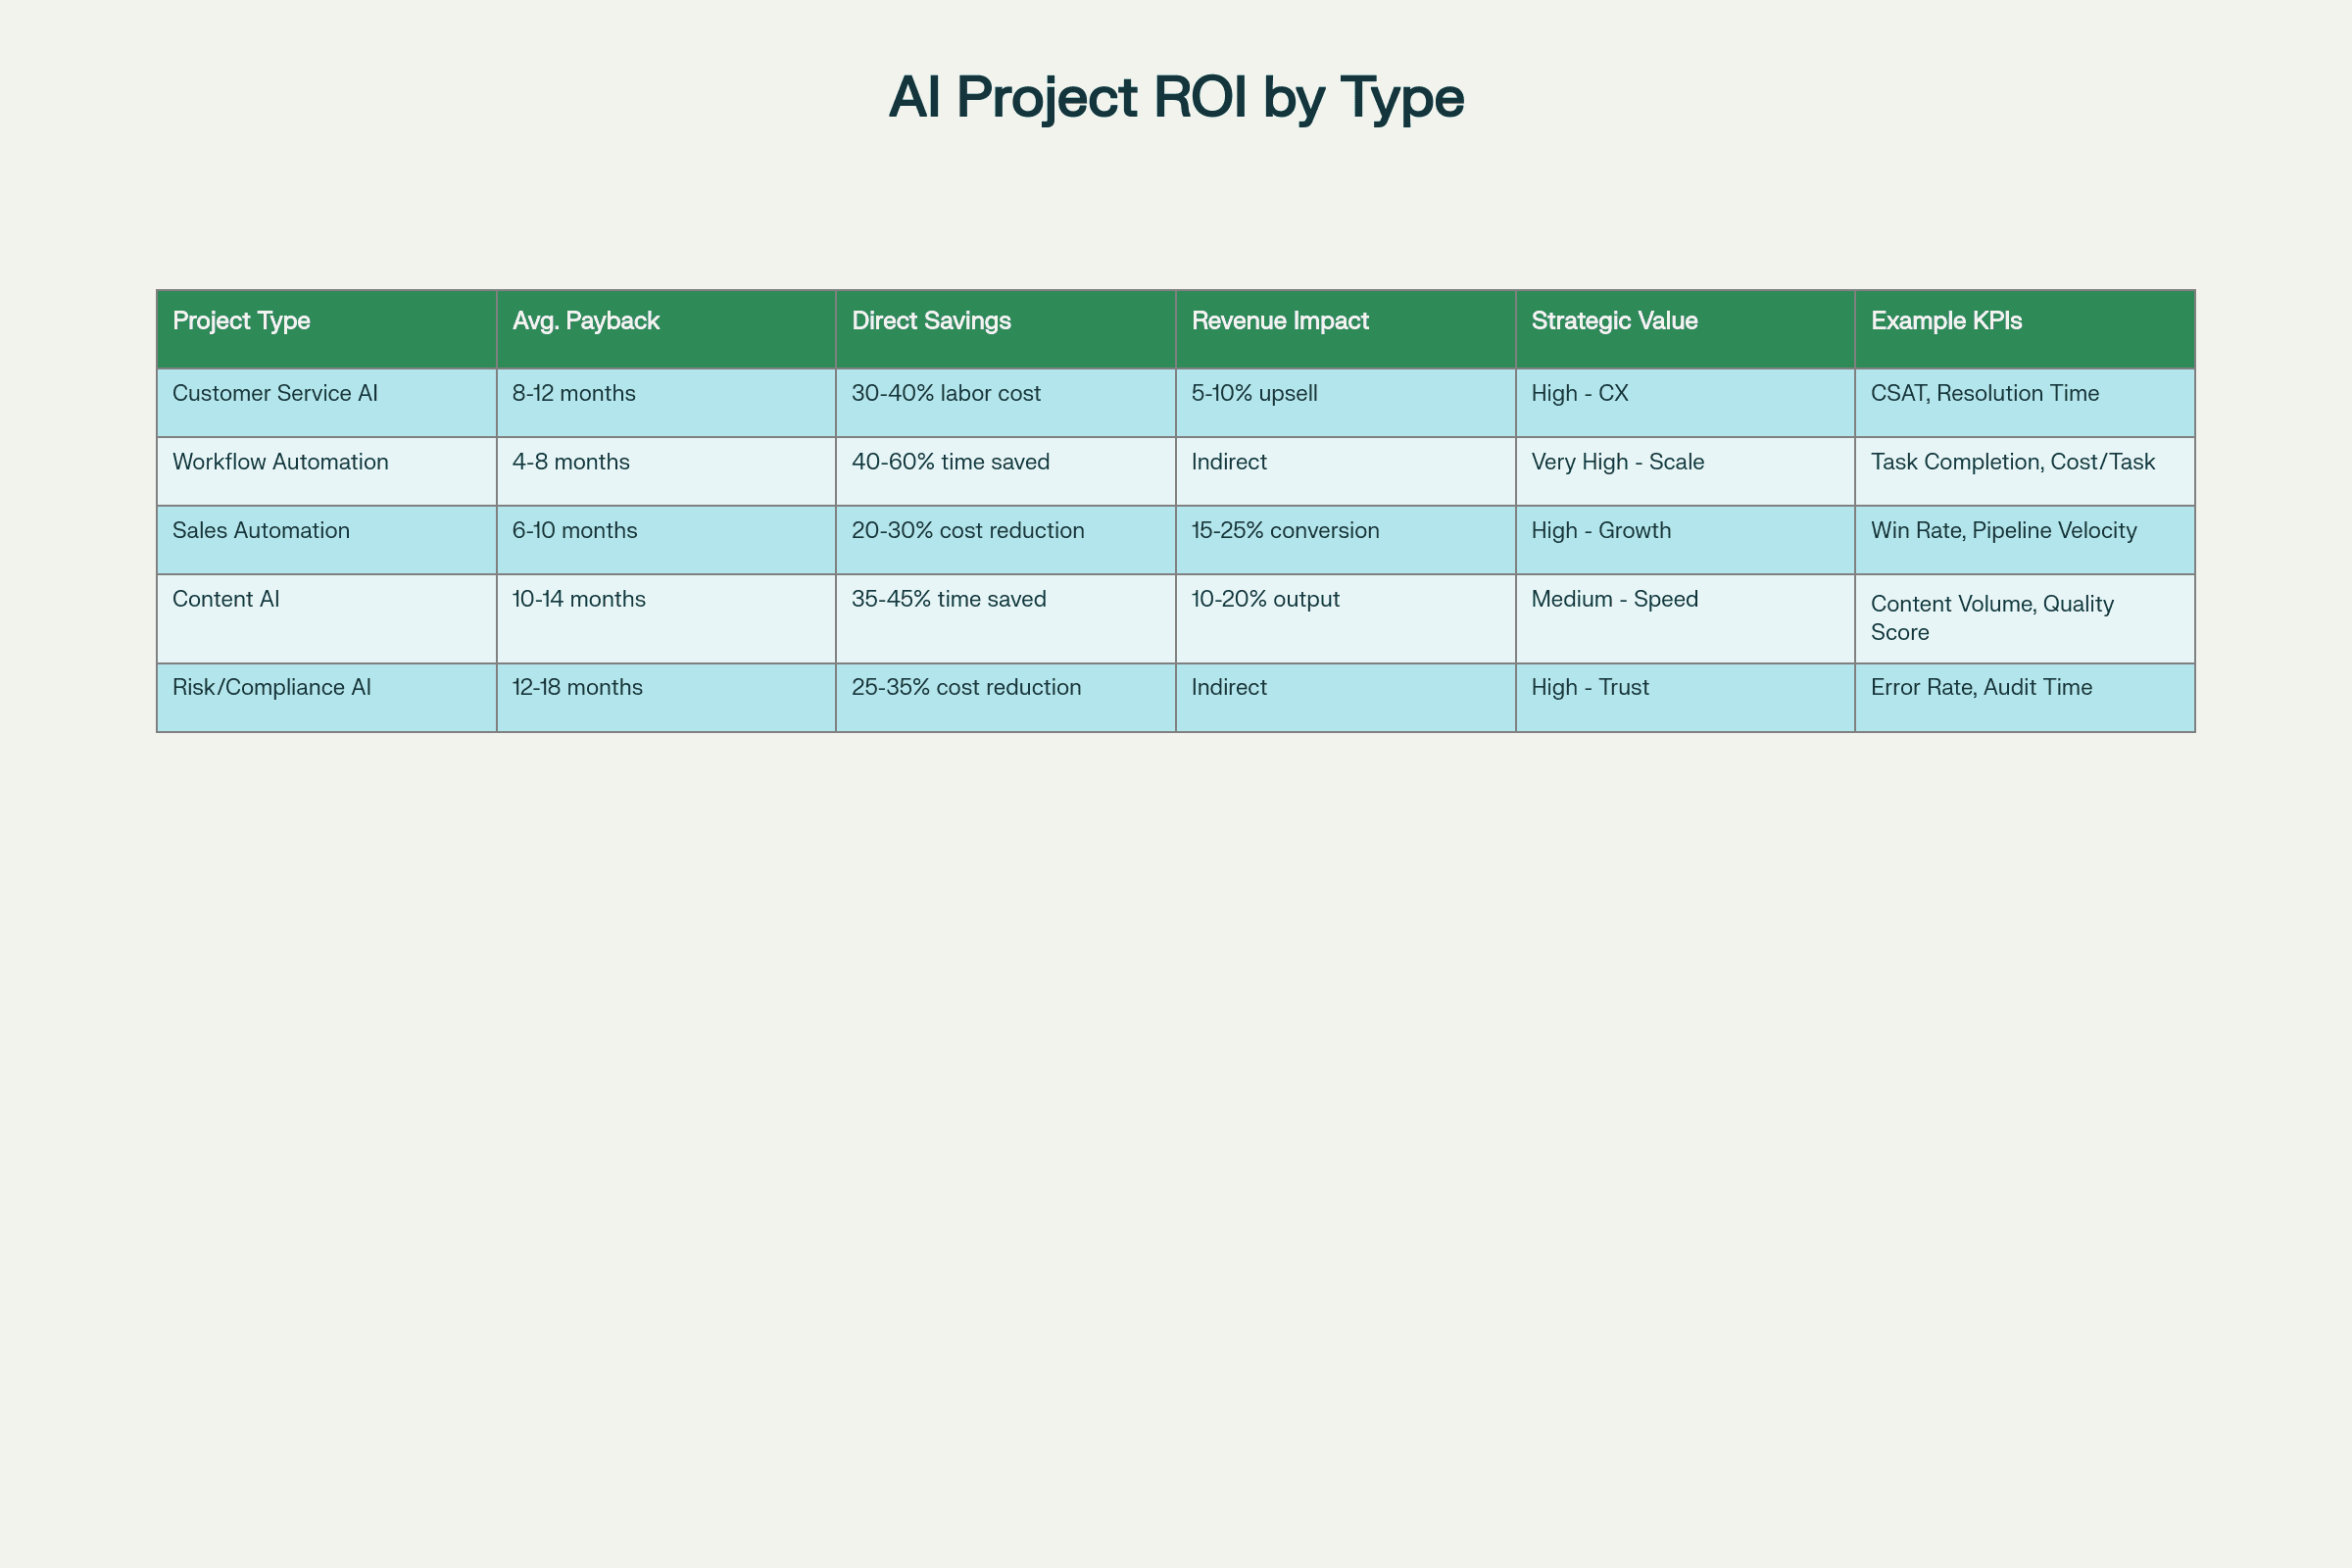
ROI Benchmarks by Project Type
Project Type | Avg. Payback | Direct Savings | Revenue Impact | Strategic Value | Example KPIs |
|---|---|---|---|---|---|
Customer Service AI | 6–12 mo | 40–60% cost cut | +CSAT, retention | 24/7 scale, agility | Cost/case, CSAT, escalation |
Workflow Automation | 3–9 mo | 1–3 FTE/funct. saved | +prod., uptime | Error drop, traceability | Time saved, manual actions |
Sales Automation | 6–18 mo | $50K–$500K/yr/team | Deal velocity + | Personalization @ scale | Win rate, pipeline velocity |
Content AI | 2–8 mo | 80% lower cost/post | +SEO, traffic | Brand scale, agility | Content speed/quality, leads |
Risk/Compliance AI | 8–24 mo | Lower fines 20–90% | Indirect | Brand/trust, audit ready | Breaches, time to close |
Most projects targeting manual labor/ops see ROI <12 months.
Strategic/revenue projects (content, sales) can drive up to 10x ROI when targeting top/funnel activities.
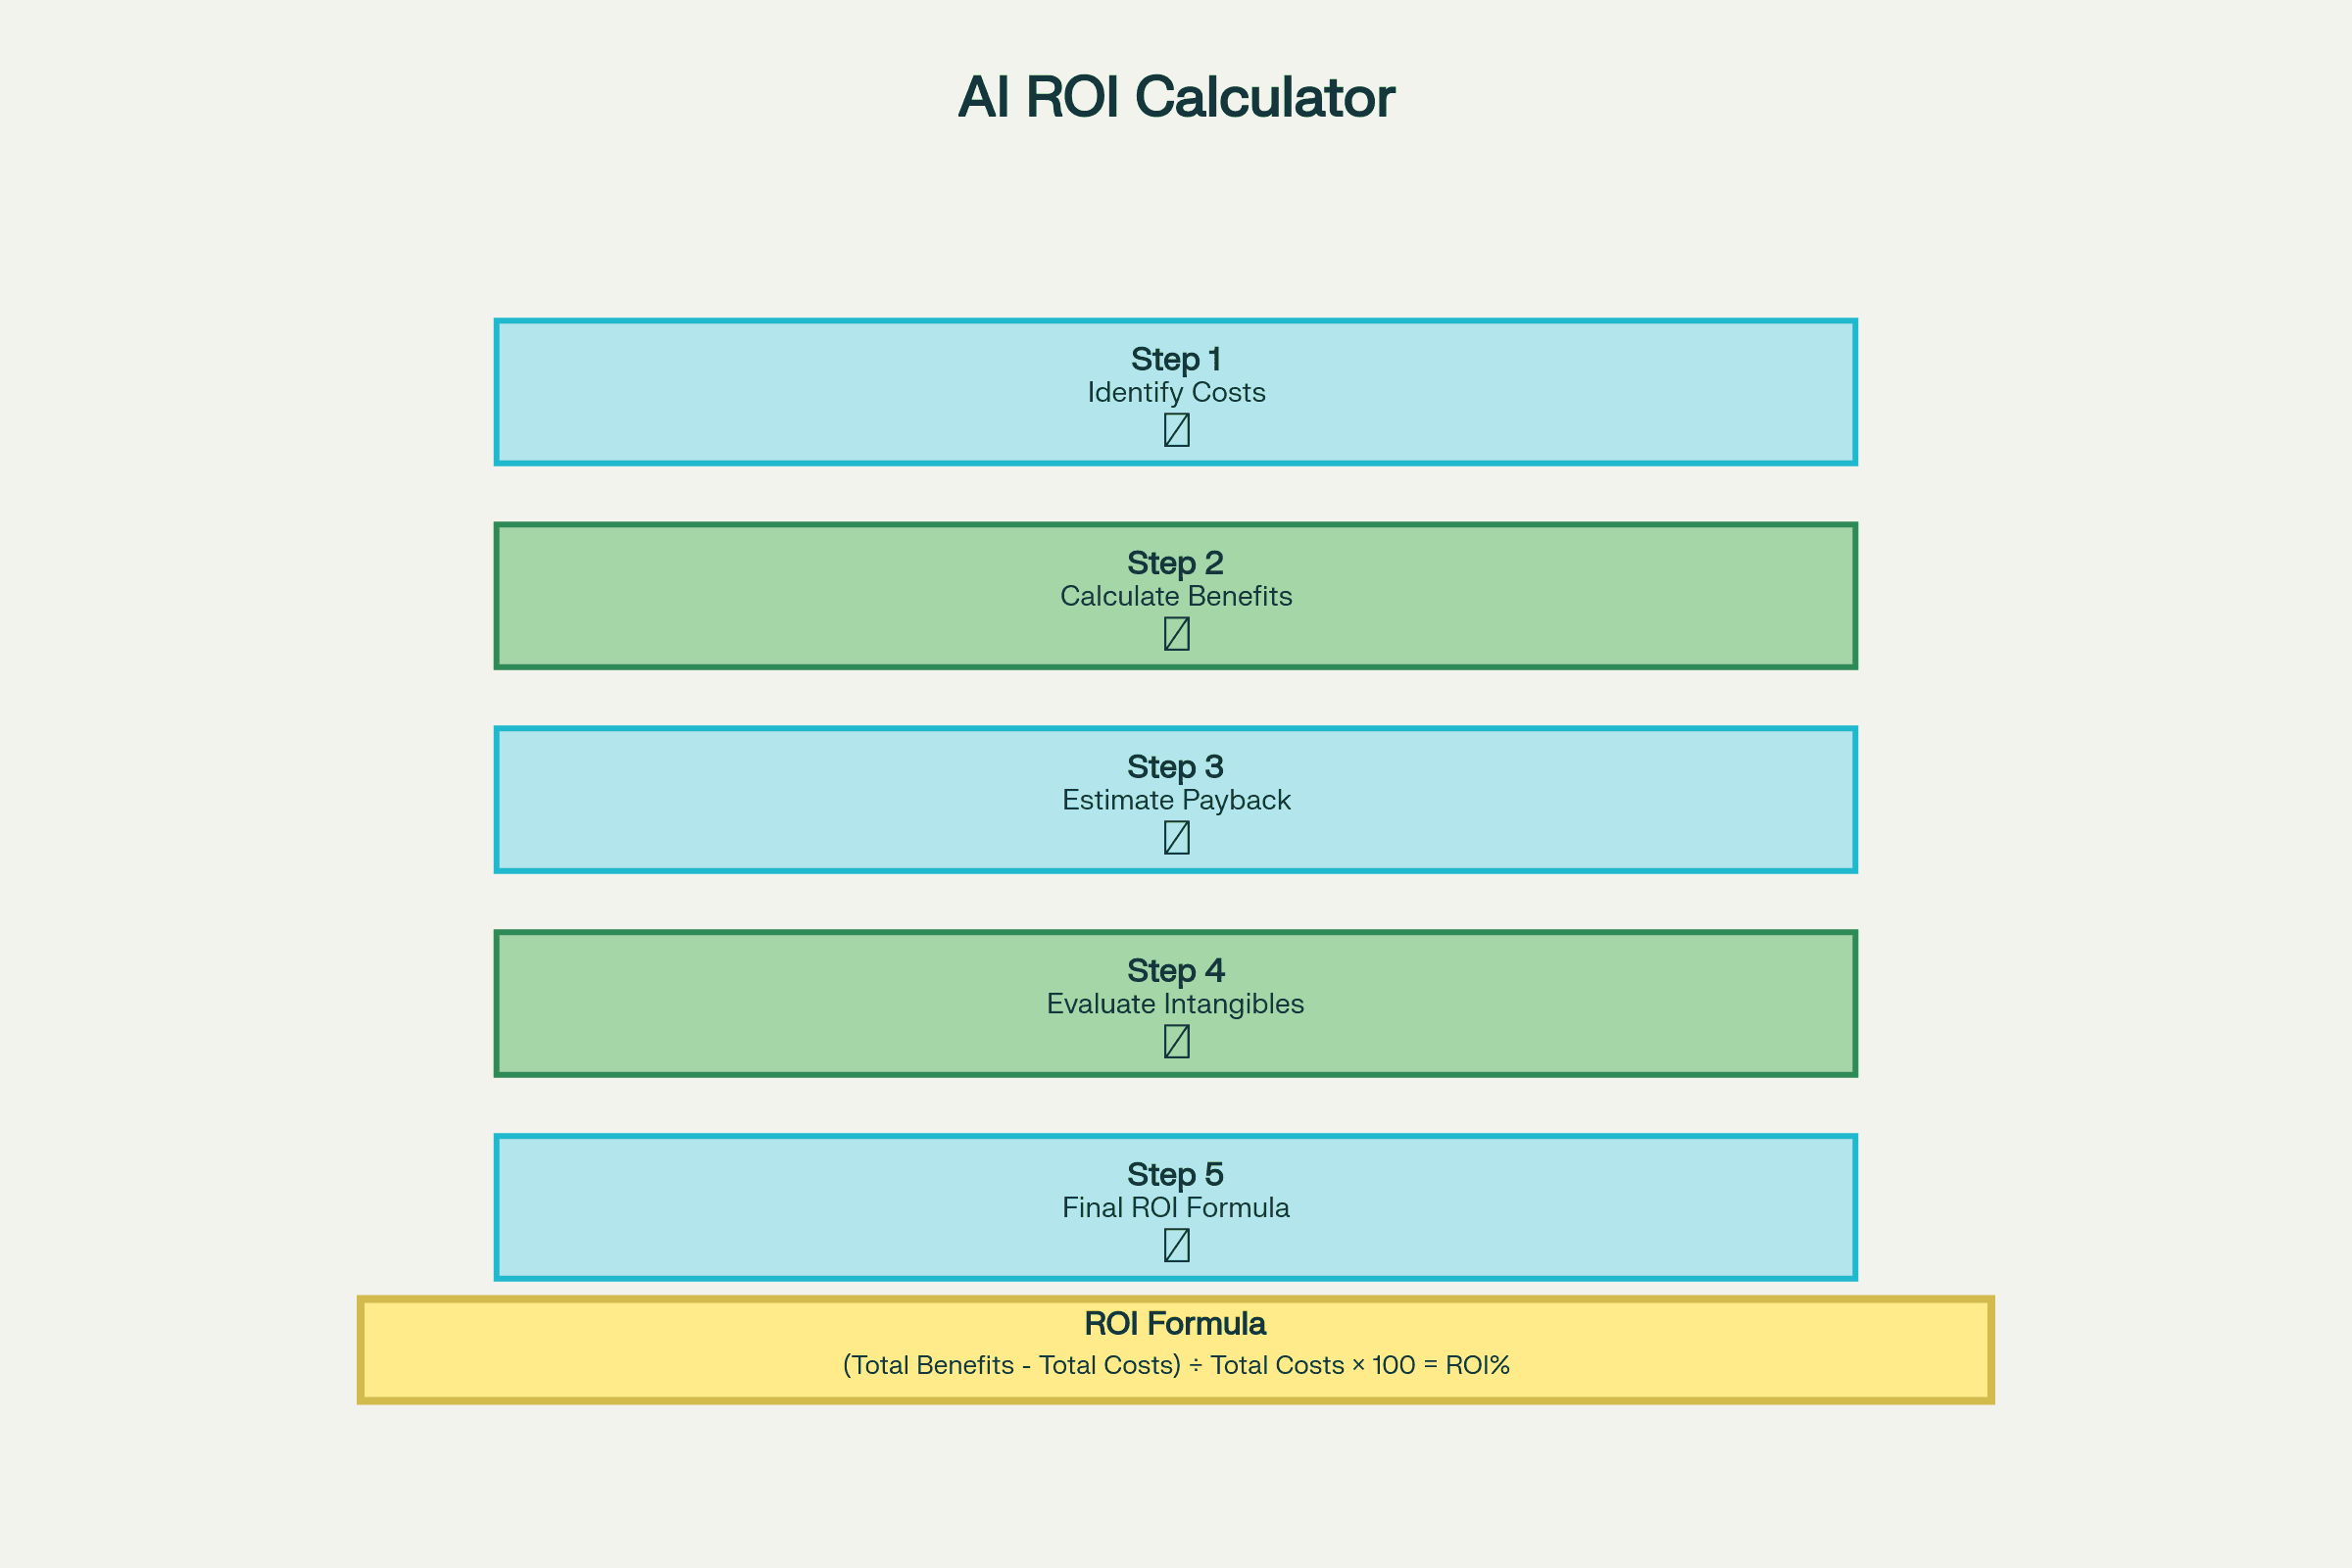
How to Calculate AI ROI: Step-by-Step
Step 1: Quantify All Costs
Direct (software, implementation, dataset, compute, platforms, consulting)
Indirect (training, downtime, process changes, support)
Step 2: Estimate All Tangible Benefits
Time saved × labor cost
Cost avoidance (errors/fines/delays)
Revenue uplift (conversion, retention, MRR)
Step 3: Estimate Intangibles/Strategic Value
Customer satisfaction, brand, compliance
Data/knowledge capture, innovation
Step 4: Calculate Payback and Final ROI
[
ROI% = \frac{Total\ Benefits - Total\ Costs}{Total\ Costs} \times 100
]
Step 5: Validate and Monitor Monthly
Compare to baseline, revise as needed
Formula Example:
If a $50,000 AI pilot saves 2 analysts’ time (worth $90,000/year), cuts errors (worth additional $14,000/year), total investment = $62K, first-year benefit = $104K:
ROI = (104K - 62K) / 62K × 100 = 67.7% (payback in 7 months)
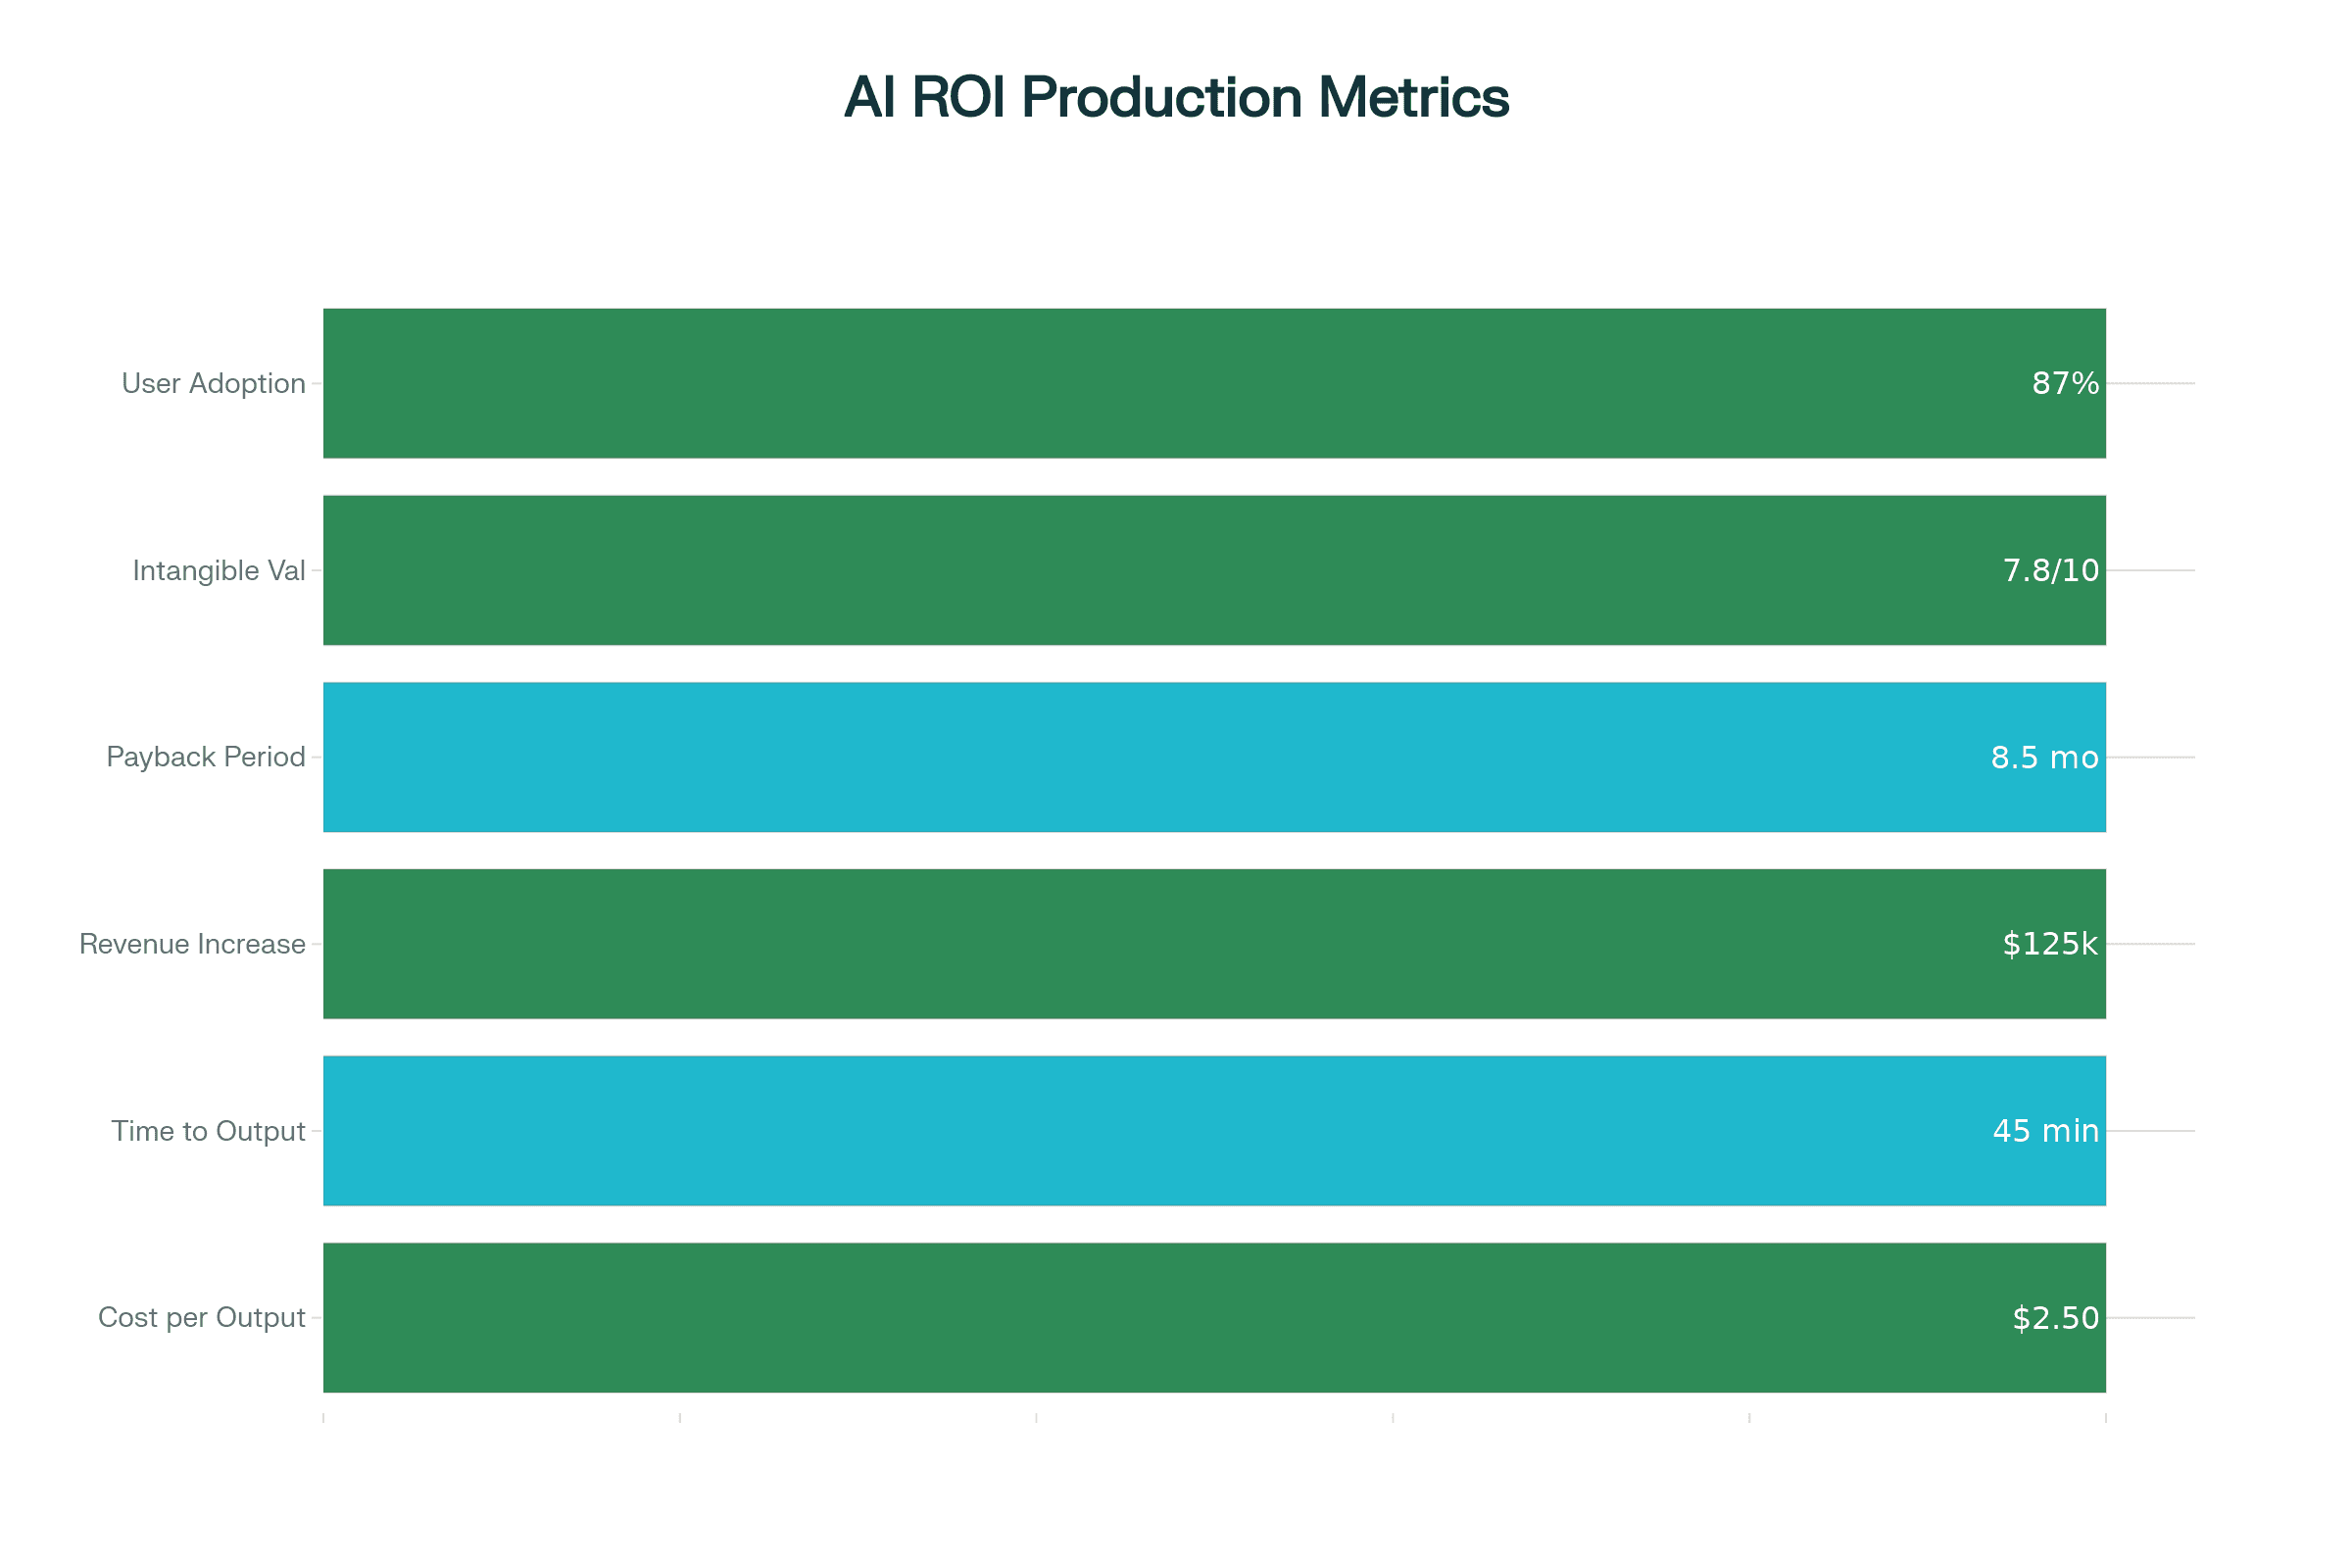
Live Metrics & Dashboards
Track these for ongoing proof and optimization:
Cost per Output: Down vs. baseline
Time to Output: Hours → minutes; bottleneck?
Revenue Increase: Lift vs. forecast/campaign baseline
Payback Period: How fast to breakeven
Intangible Value: Survey/brand/NPS/employee experience
User Adoption (%): Higher adoption = faster ROI
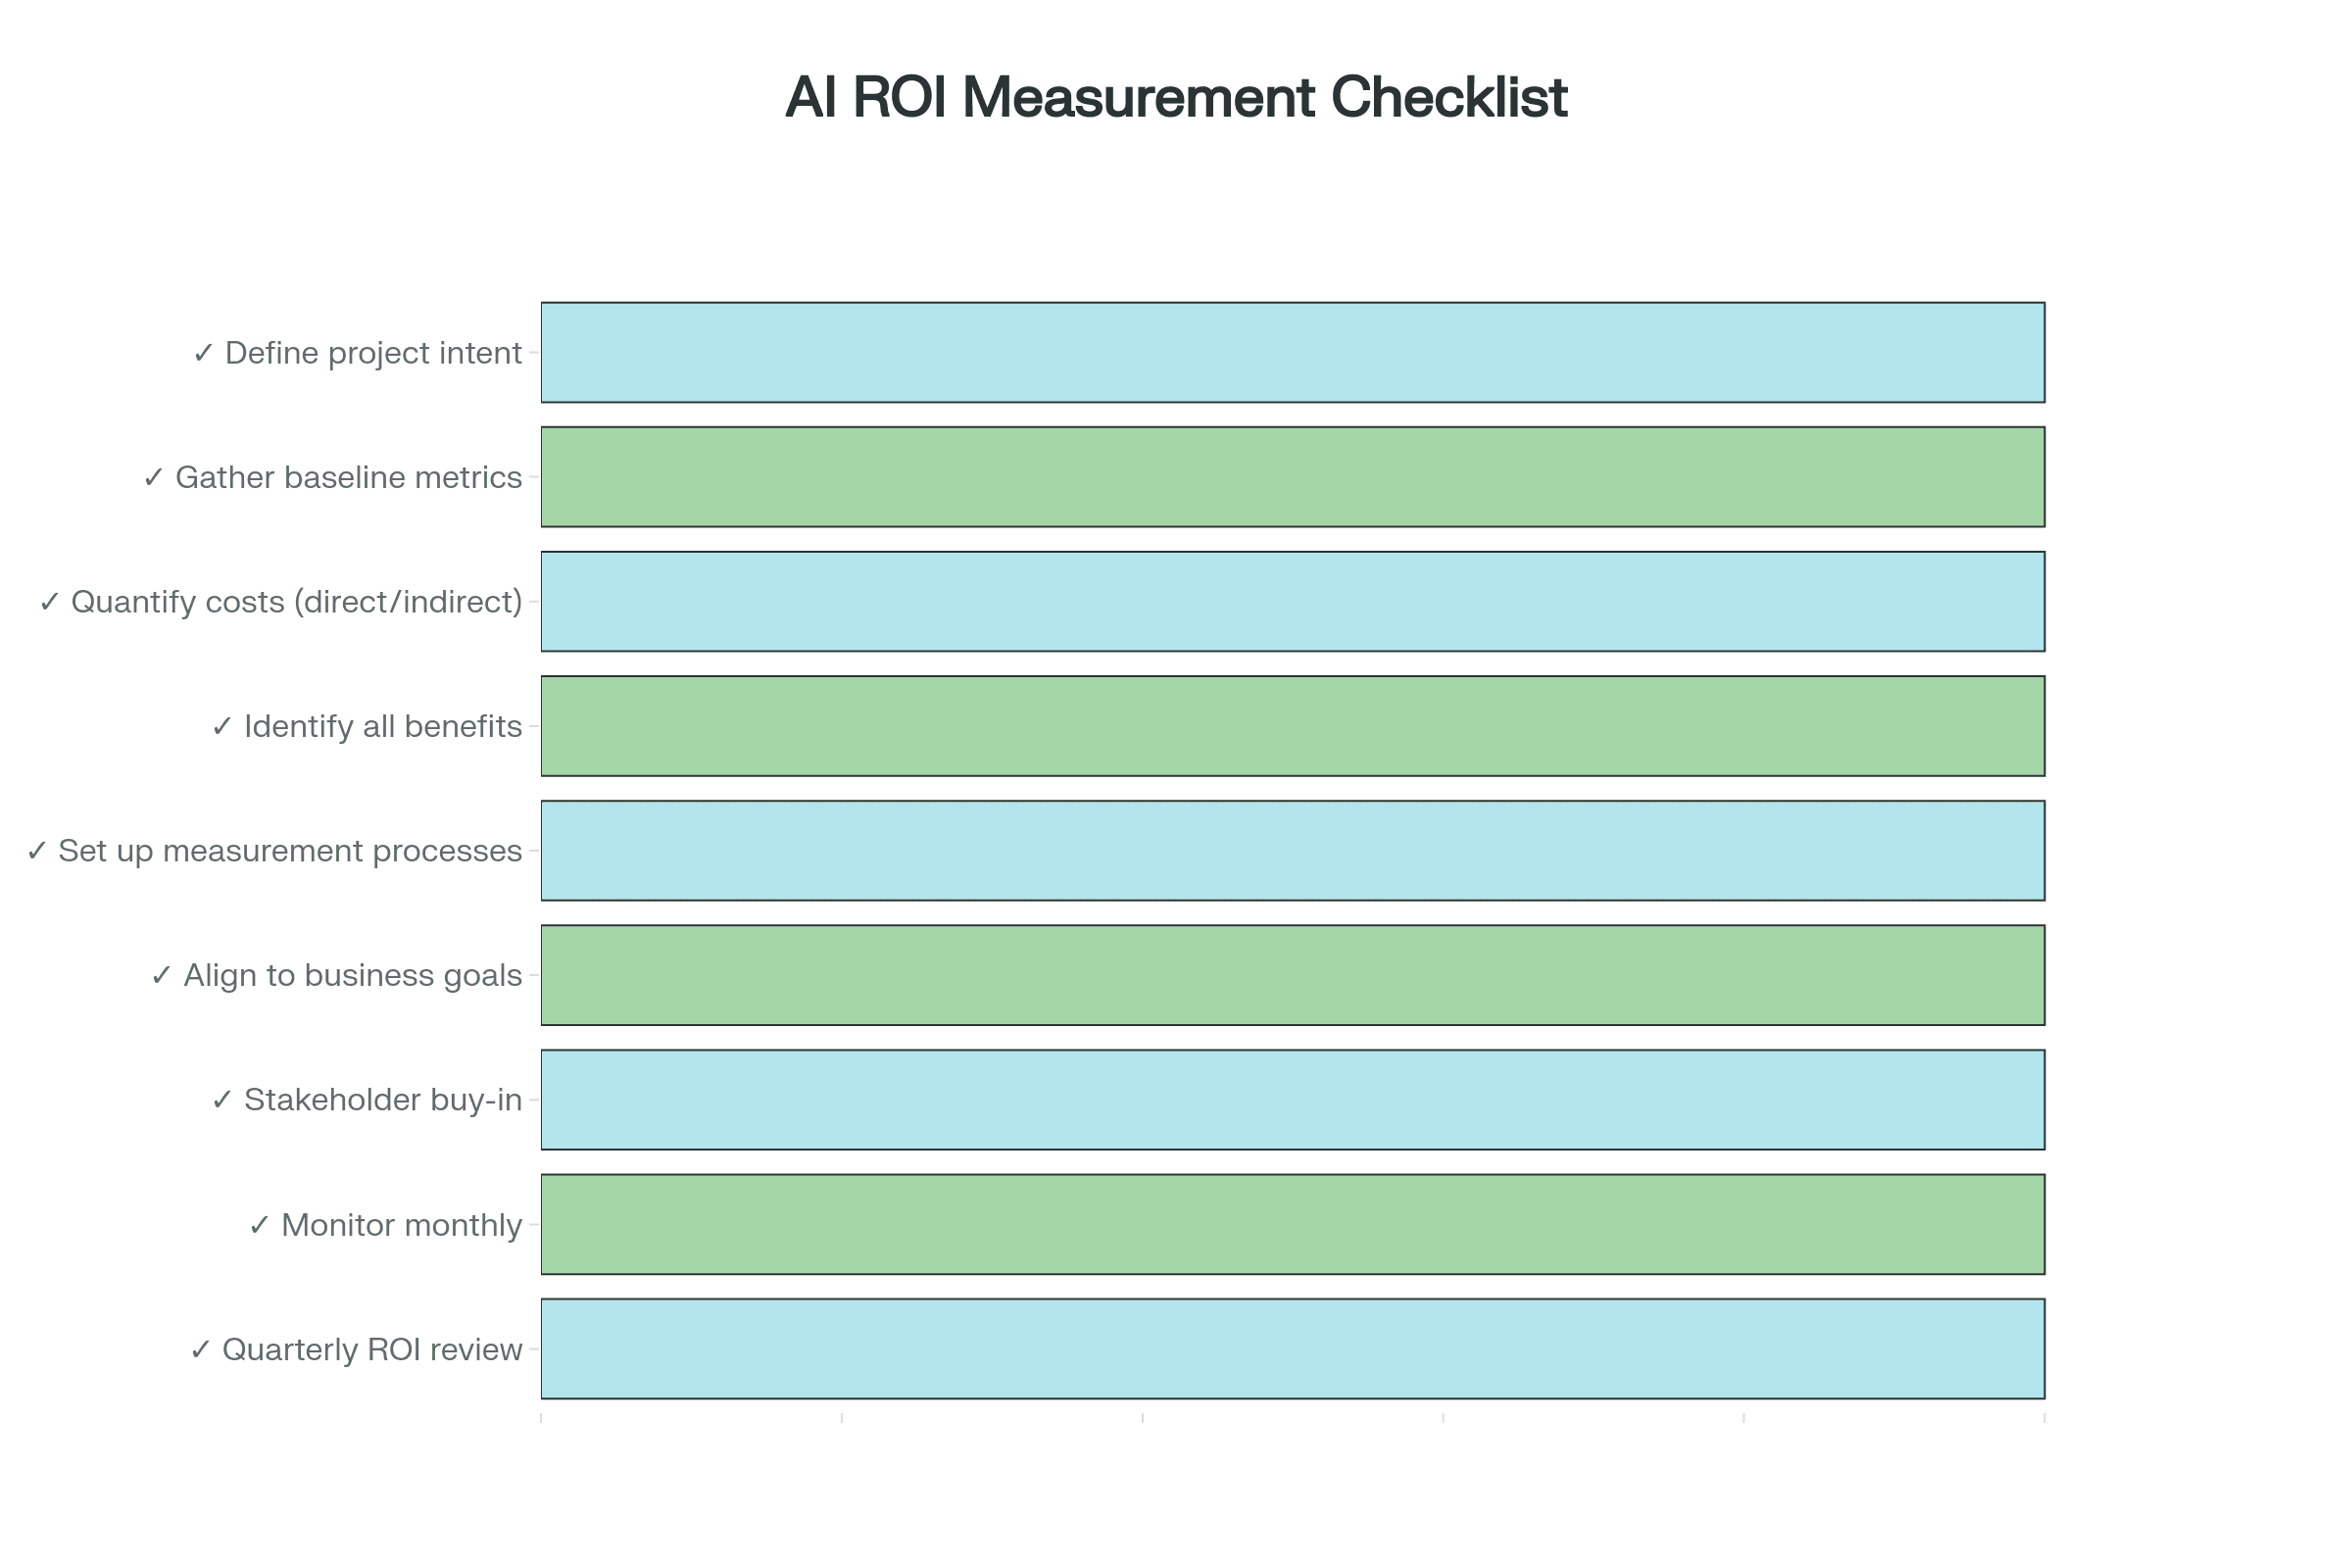
Implementation Checklist
Define project goal, scope, and business problem
Gather and validate baseline metrics/data
Quantify all costs—software, integration, process
Identify and detail all measurable benefits
Design a measurement process (before/after)
Align KPIs to bottom-line business outcomes
Get stakeholder buy-in up front
Monitor monthly, adjust as needed
Do a quarterly ROI review
Conclusion
In 2025, AI impact is real—but only ROI wins budget and expansion:
Track both quick wins and strategic value.
Report trends monthly, make business cases clear.
Don’t let “hard to measure” mean “easy to ignore.”
Bring data to every AI decision.